A table of terms used in this tutorial is below:
| Term | Definition |
|---|---|
| CAID | Continuous Assurance-Integrated Development |
| Git | A distributed version control system |
| GSN | Goal Structured Notation |
| WebGME | Web-based Generic Modeling Environment tool |
Table of Contents
- Introduction to CAID
- Starting the CAID Demo
- The Depi
- Visualizing Dependencies using the
Depi - CAID and WebGME
Introduction to CAID
When developing a software system, it is necessary to use different tools to represent and work with different aspects of the system. For instance, one may use WebGME to model the architecture or components of a system, use GSN models to evaluate the system's safety, and use Git to manage code that implements the system as well as code and data that is used to test the system.
| Tool | Description |
|---|---|
| WebGME | Used for graphically modeling complex systems. Interpreters can traverse these models to generate any type of artifact, e.g. software source code that implements the models. |
| GSN | Used to model and evaluate a system's safety, using tree-structured assurance arguments. Results of tests, e.g. on software generated by WebGME and managed by git, are represented in the evidence nodes of the GSN tree. |
| Git | Used for source control of code and data for system implementation and system reliability evaluation. |
When a change to the system is made in one of these tools, concomitant changes must be made in the other tools so they remain in synchrony. Thus, there are dependencies between these tools. CAID is used to manage the dependencies between these different tools in order to keep their respective aspects of the system in synchrony.
This tutorial demonstrates the functionality of CAID.
Starting the CAID Demo
When you first start the CAID demo, you may see what looks like a rocket ship. This means the system is still initializing:
When the system is done initializing, you will see this initial Welcome screen: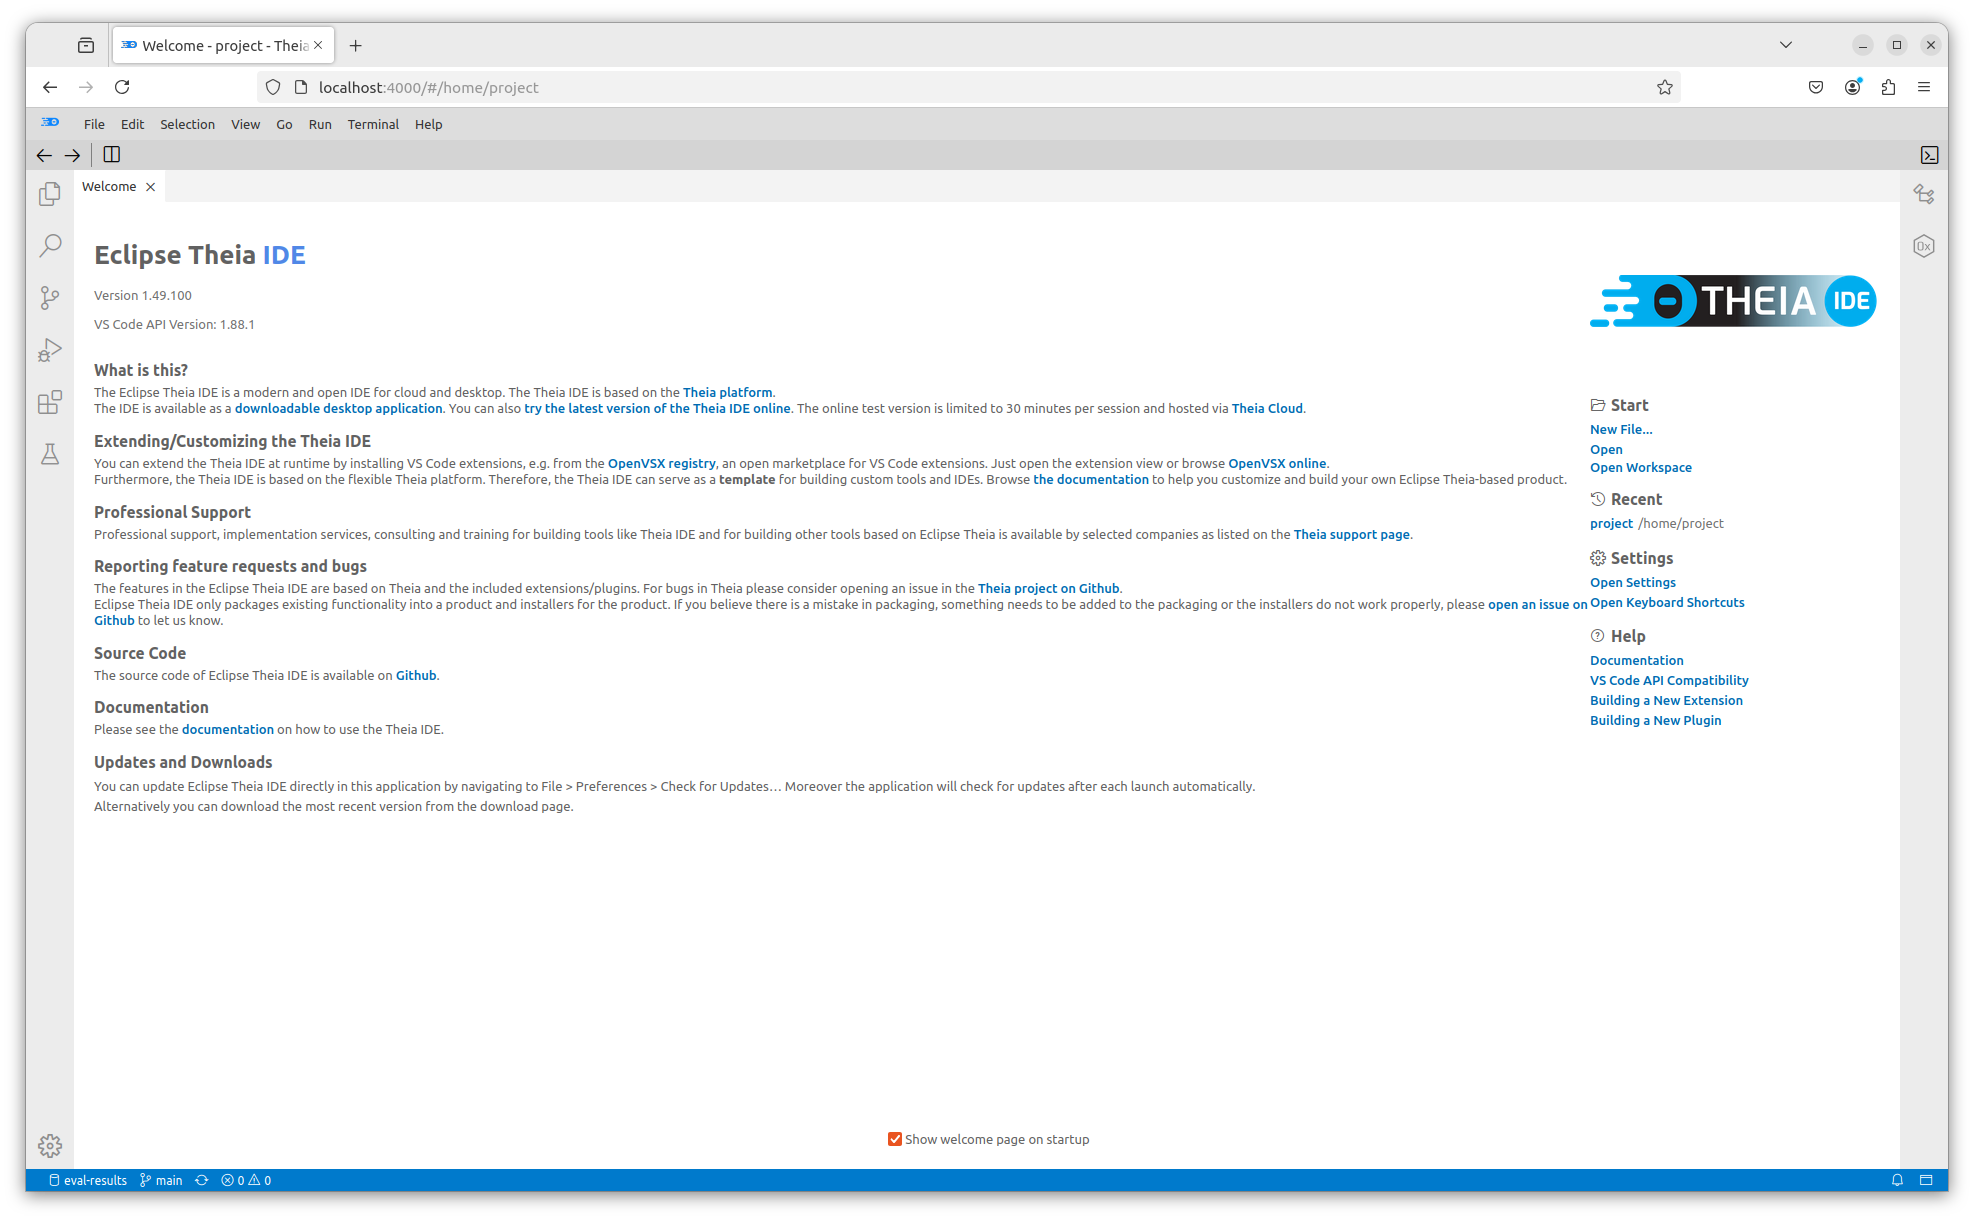
Open the Explorer pane by clicking on the Explorer Button![]()
near the top left corner of the window: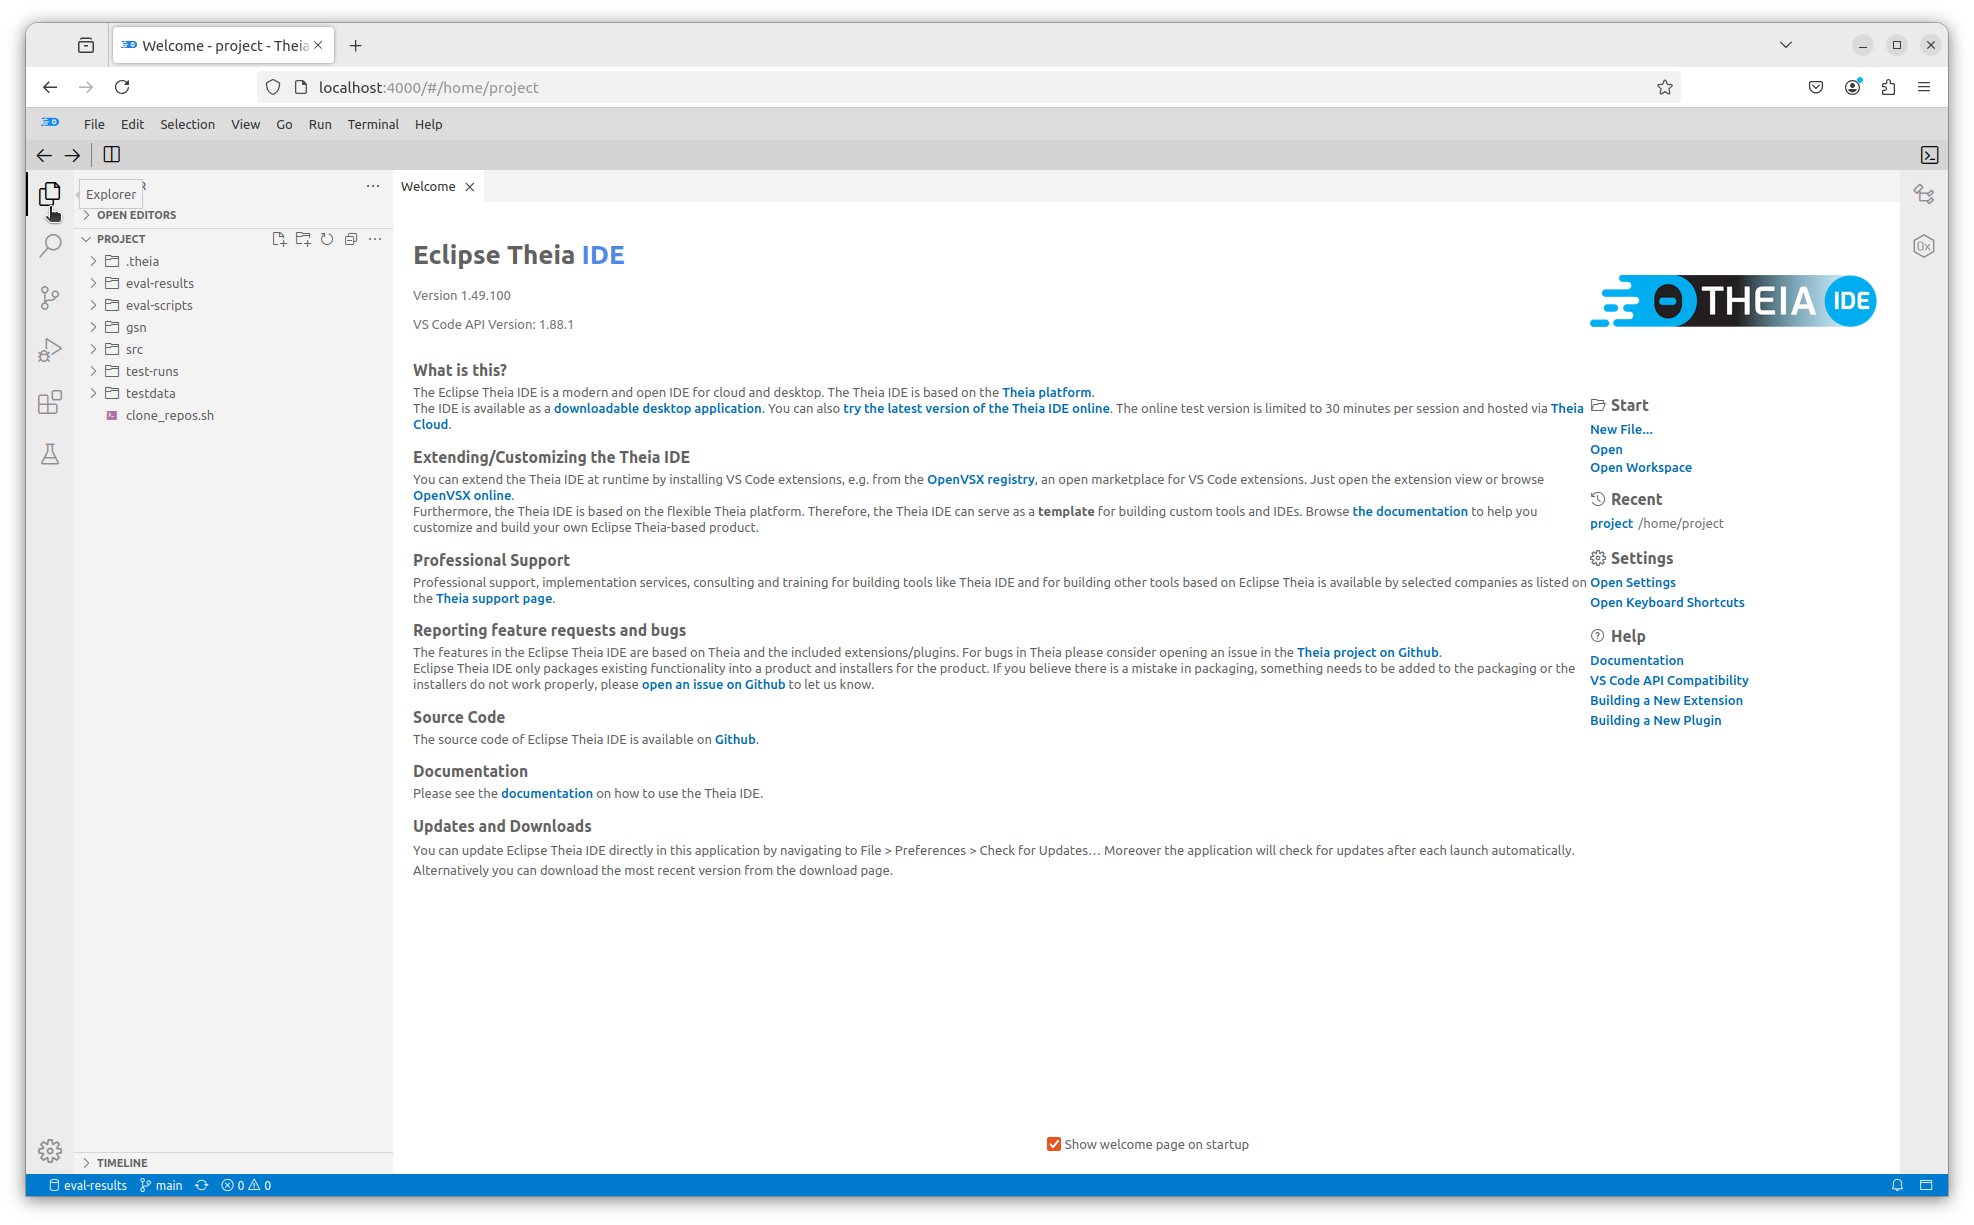
The Explorer pane will appear on the left side of your browser window.
NOTE: The area to the right of the
Explorerpane, where theWelcomeis currently displayed,
is called theEditorpane. It is where graphs and the contents of various files will be displayed.
The directories displayed in the Explorer (all except .theia) are local clones of git repositories whose contents are interdependent. The clone_repos.sh script was run in order to create them from the content of a git repository server (a gitea instance). You can see the contents of the clone_repos.sh script by clicking on it in the Explorer: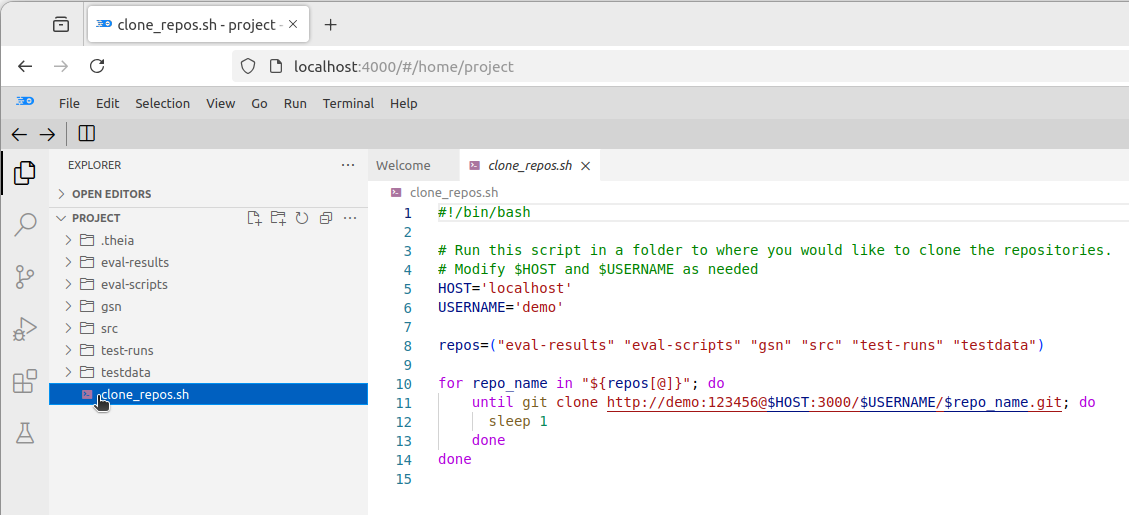
The repositories are listed in the below table:
| Repository | Description |
|---|---|
| src.git | Source code for a UAV control system (skeleton). |
| test-runs.git | Source code for programs that test the UAV for proper functioning (skeleton) |
| testdata.git | Test input data for the UAV control system |
| eval-results.git | Test result data for the UAV control system |
| eval-scripts.git | Source code for programs that use the data from testdata and eval-results to evaluate the safety and functionality of the UAV control system |
| gsn.git | GSN (Goal Structured Notation) models which use the results from the eval-scripts to build assurance cases for the UAV control system |
The Depi
Implicitly, there are dependencies between the 6 repositories above. For example:
- If there is a change in
src, thetest-runsmust be rerun - If the
test-runsare re-run, thetest-datamust be used in these runs. - If the
eval-scriptsare rerun, theeval-resultsmust be updated - If the
eval-resultsare updated, thegsnmodel must be updated to reflect any new results.
Trying to manage these implicit dependencies manually would be labor-intensive and error-prone. The Dependency Server, or Depi, is the component of CAID that makes these dependencies explicit, recording them from user input and then managing them automatically. In particular, the Depi will detect when a change is made to a particular resource and flag them for inspection and manual update. Because of this, the user can now keep track of what resources need to be updated.
The Depi Blackboard
The dependencies between the various resources in the various git repositories can be viewed on theDepi Blackboard. To see the blackboard, click on the Command Palette button![]()
in the upper right corner of your browser window: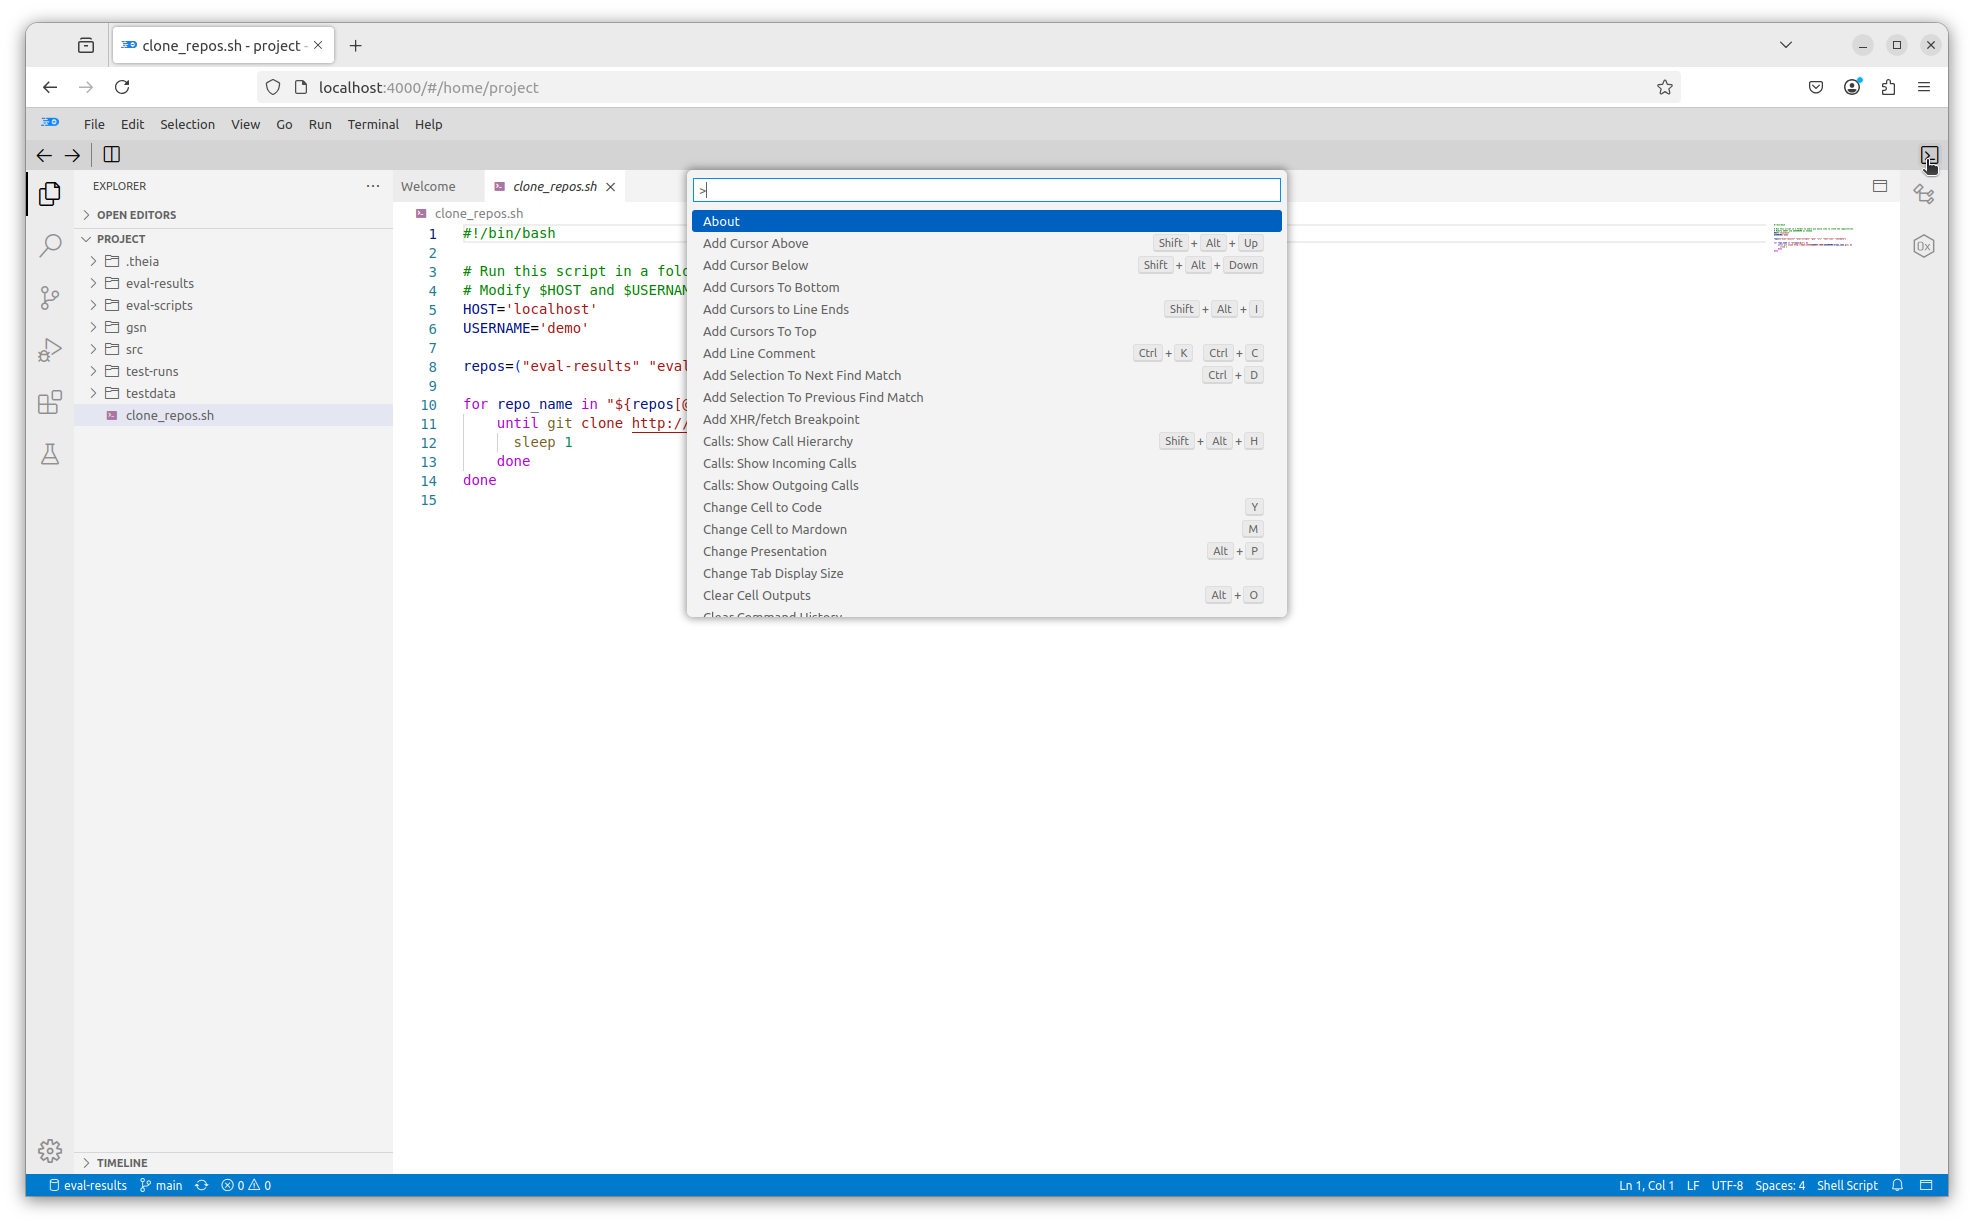
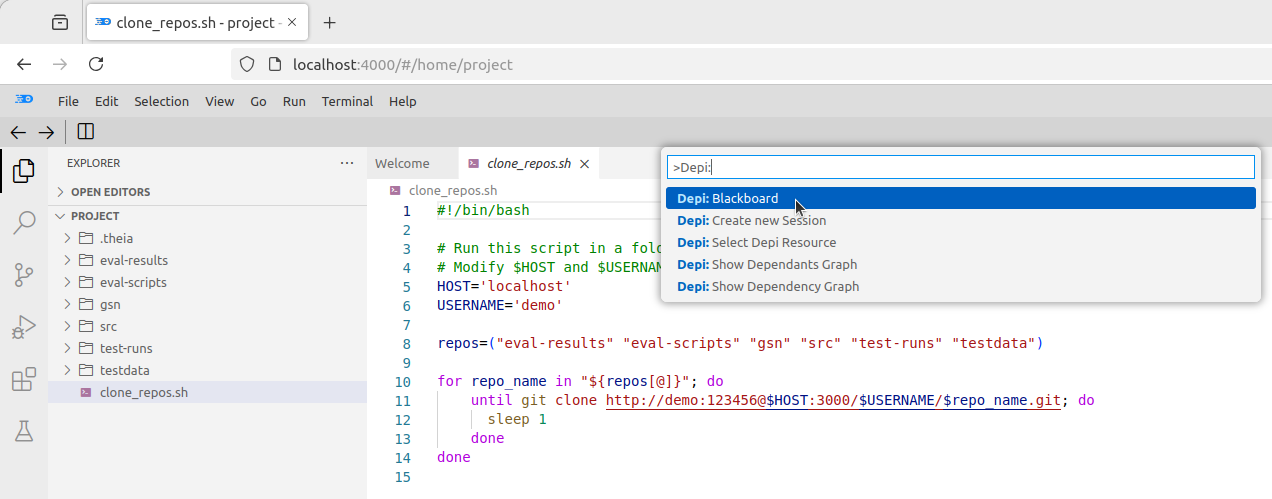
In the resulting text field type the text below and press <enter>:>Depi: Blackboard
NOTE: The right chevron
>in the above text is VERY IMPORTANT.
NOTE: To get this same text field to appear, you can press Ctrl-p (press and hold the control-key
while pressing the "p" key). Note that Ctrl-Shift-p will not work for the CAID tool when it is
used in a browser, as it is here.
NOTE: As you type, selections will appear in a drop-down menu below the text field. To get the
Depi Blackboardto appear, you may either type in all of the text as above followed by the<enter>key, or click on theDepi: Blackboardselection with your primary mouse button when it appears.
The Depi Blackboard will be displayed in a sub-pane in the right side of the Editor pane: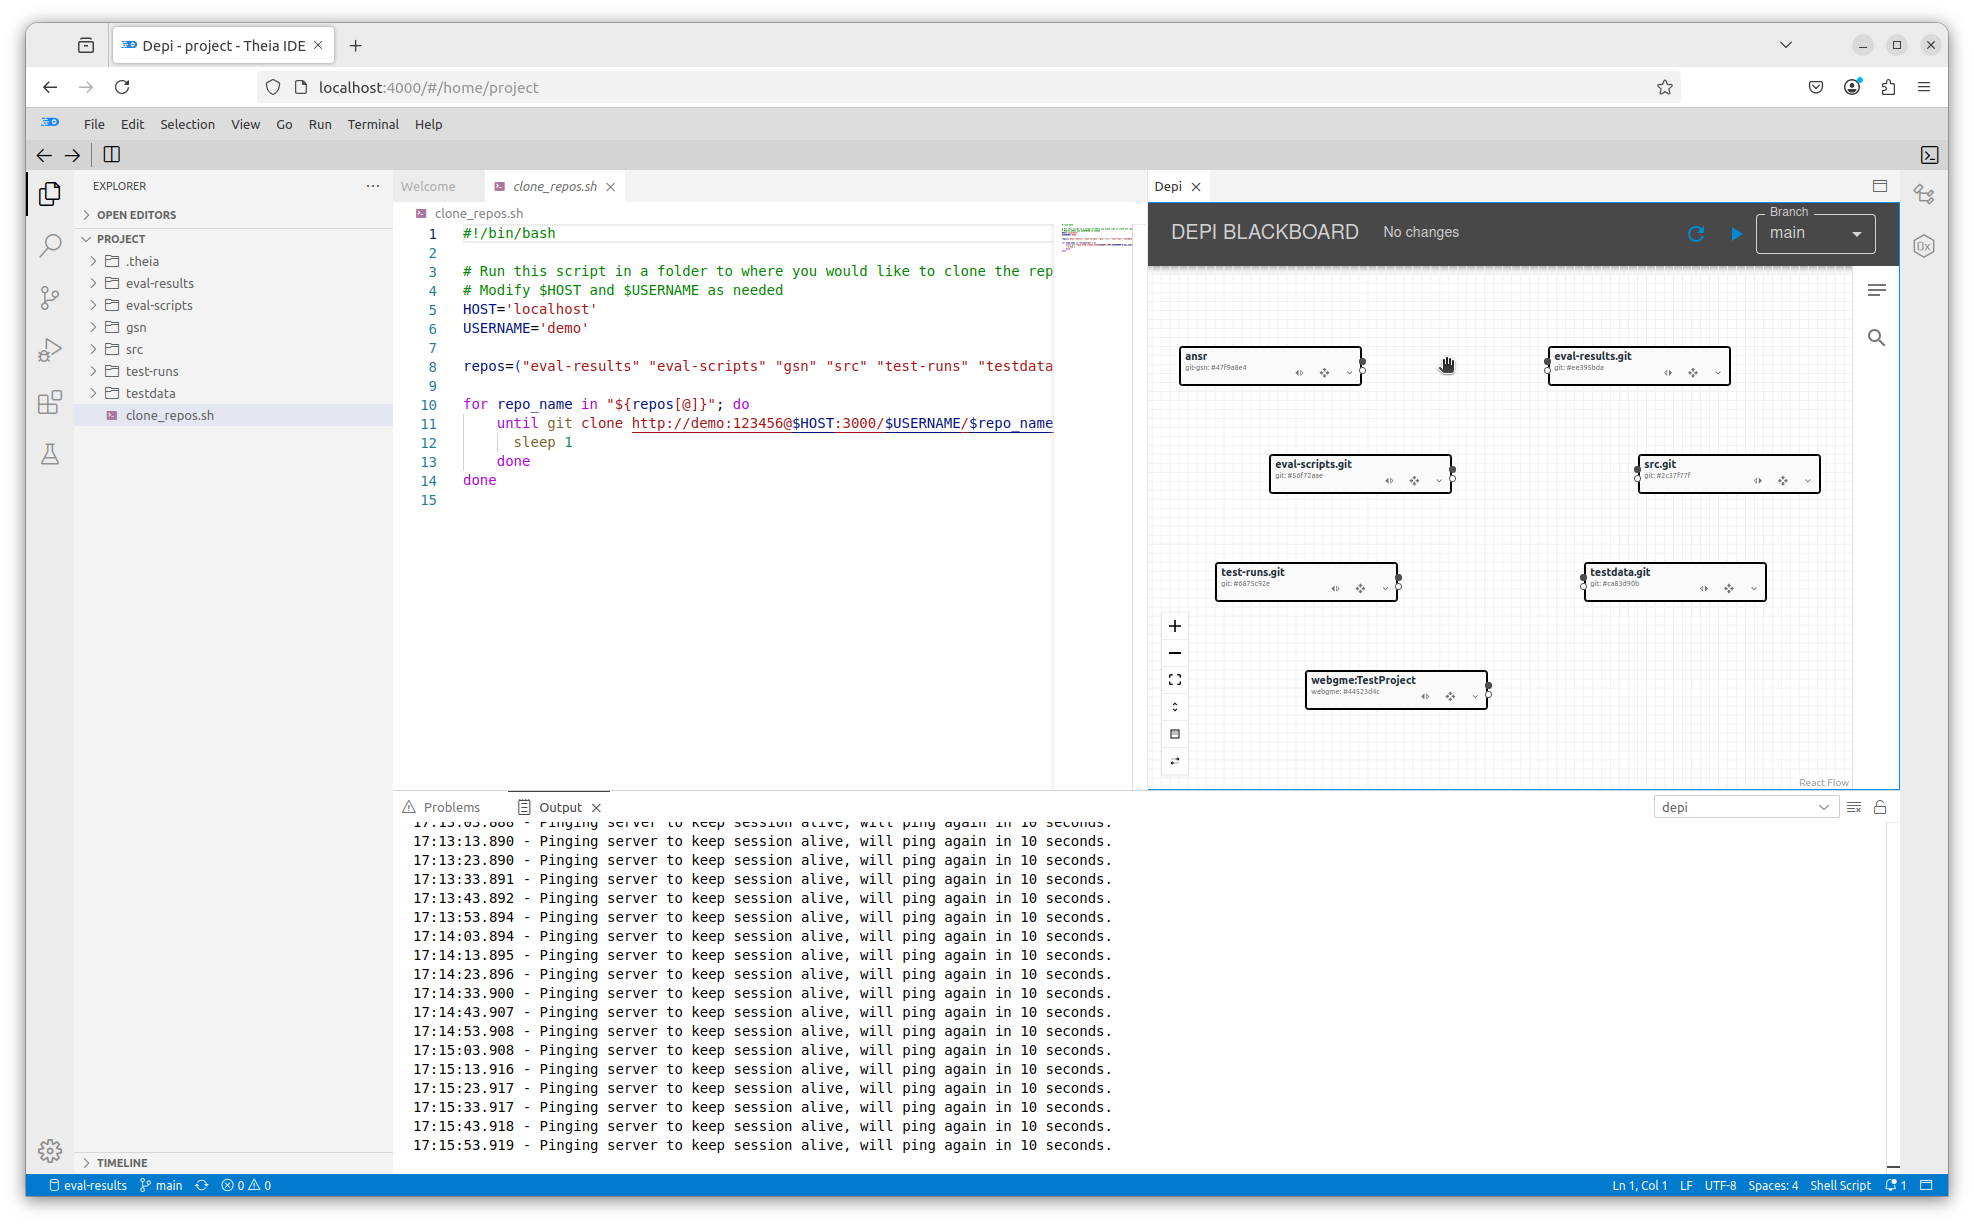
In the Depi Blackboard, you will see rectangles that correspond to each of the repositories listed above. Note that there is one rectangle that does not correspond to any of the above repositories: webgme:TestProject. This rectangle represents a WebGME model of the UAV, called TestProject. In particular, it models all of the components of the UAV, e.g. rotors, batteries. Clicking on the expand button
(![]() )
)
in any of these rectangles will reveal some content of the corresponding repository. The expand button will
appear next to revealed content, and clicking on it here will reveal more content.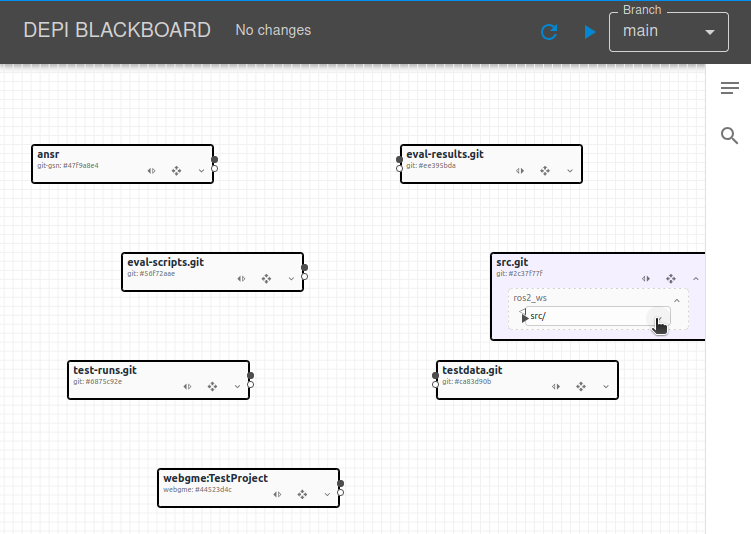
The Dependency Graph
To see a graph of the dependencies between all of the resources in all of the repositories, click on the expand all resource groups button
(![]() )
)
near the lower left corner of the Depi Blackboard sub-pane: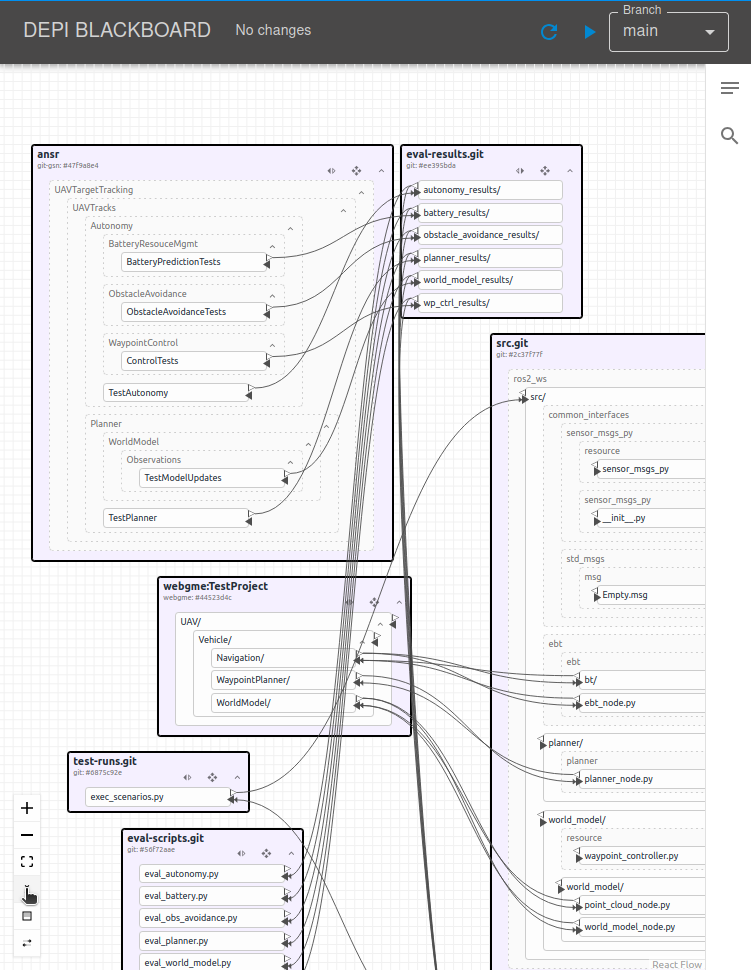
Currently, you show only be able to see a segment of the dependency graph shown in the sub-pane. To see the entire graph, click the fit view button
(![]() )
)
near the lower left corner of the sub-pane: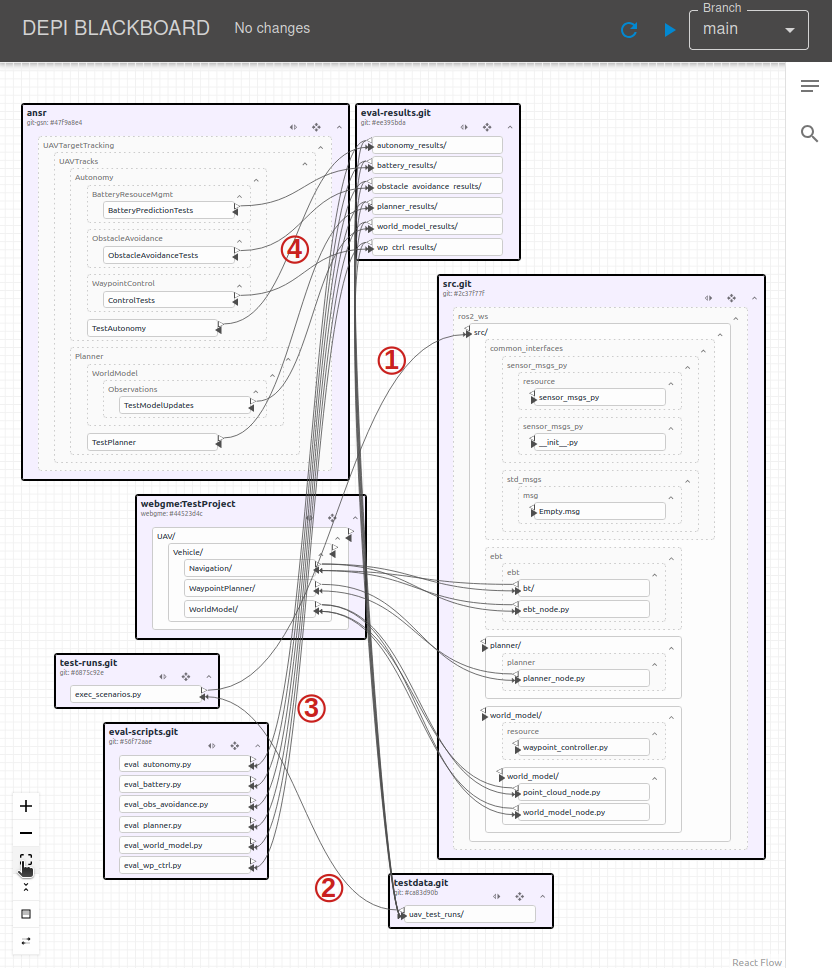
From this graph, we can see that, indeed:
- A script in
test-runsdepends on the code insrc - The
test-datadepends on thetest-runsto simulate the UAV with thetest-data - The
eval-resultsdepends oneval-scriptsto be regenerated - A
ansrgsn model depends on theeval-resultsfor its assurance case
Visualizing Dependencies using the Depi
In addition to visualizing the dependencies between resources in a project, the Depi can also be used to visualize the dependencies of a particular resource. Here, we will visualize the dependencies of a solution node in a GSN (Goal Structured Notation) model. Before we do this, please click on the clone_repos.sh tab at the upper left corner of the left sub-pane of the Editor pane: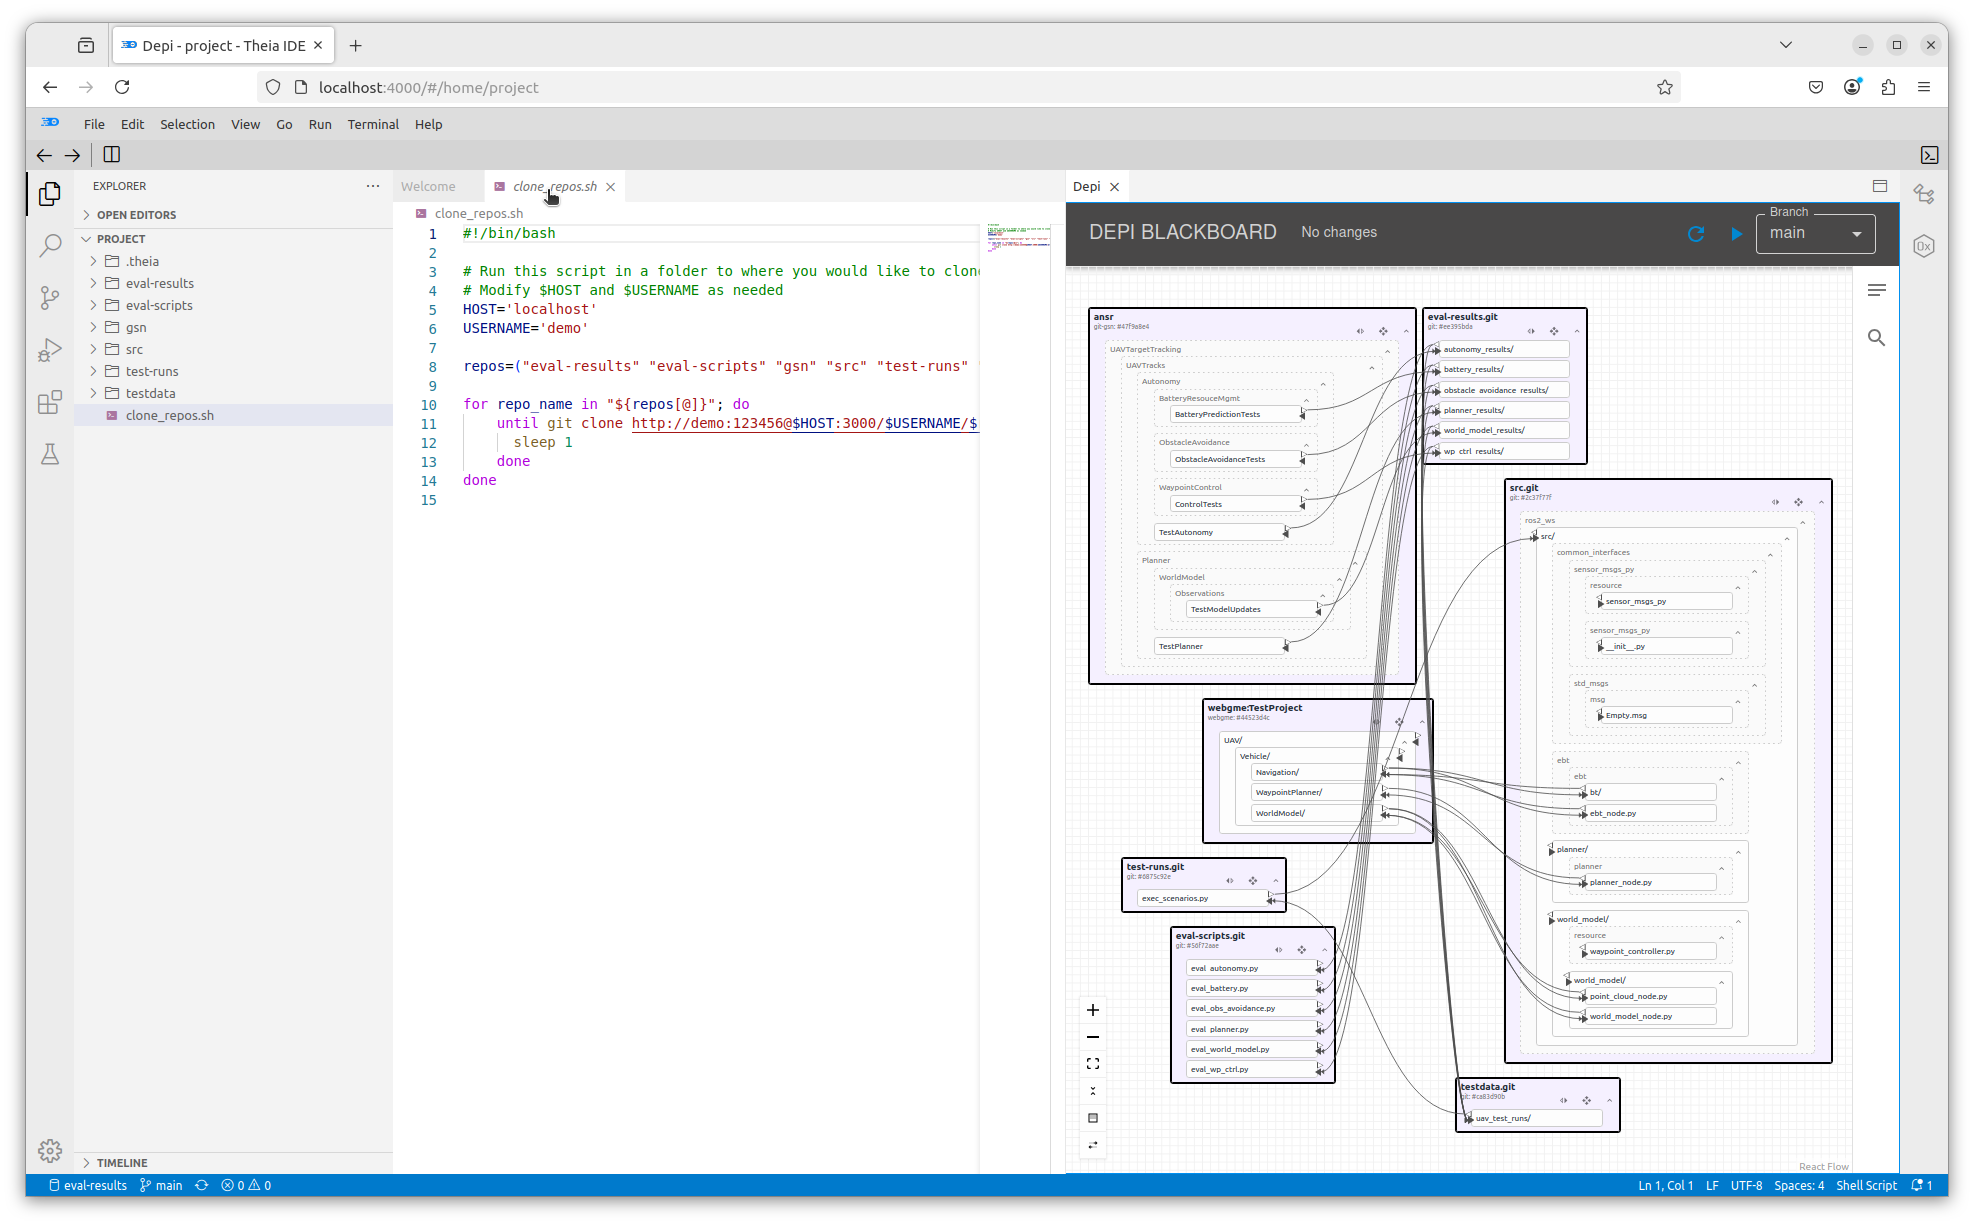
This will cause new information in the next section of this tutorial to appear in the left sub-pane of the Editor pane, leaving visible the Dependency Graph in the right sub-pane.
Goal Structured Notation
Before visualizing dependencies, we will get acquainted with the features of CAID for working with GSN models. This includes:
- Working with the text representation of GSN models
- Working with the graph representation of GSN models
- Automatic synchronization between the text and graph representations performed by CAID
The Text Representation of GSN Models
By clicking on gsn in the Explorer, and then clicking on ansr underneath it, you'll expose the ac.gsn file. Click on this file to show its contents in the left sub-pane of Editor pane.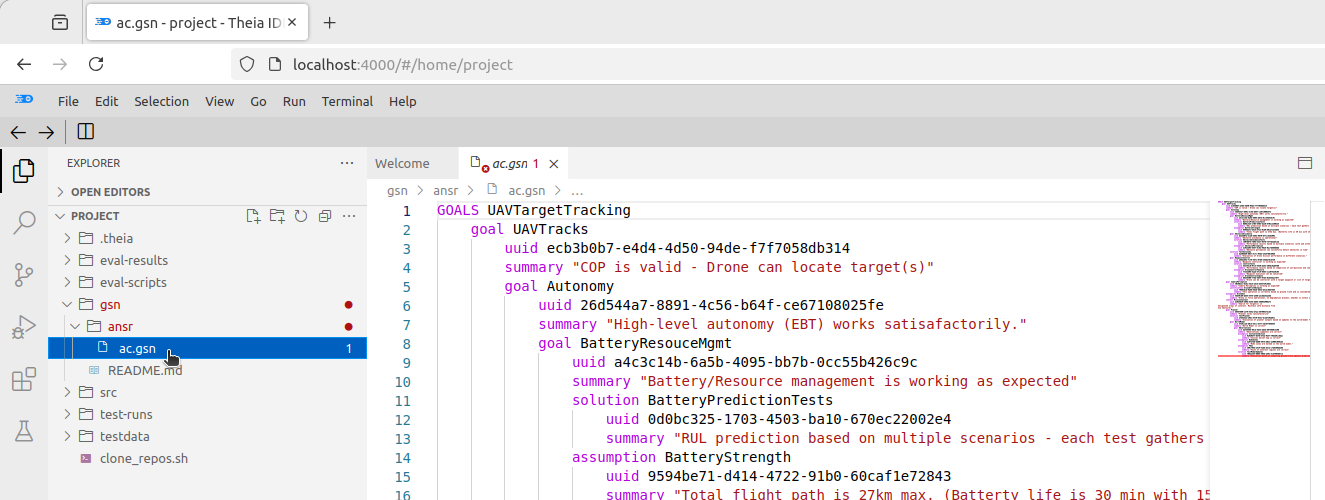
ac.gsn contains the text representation of a GSN model used to evaluate the functionality and safety of a software system. Such a model is called an assurance case. This representation consists of one or more lines that start with a keyword, followed by information that relates to the keyword. A GSN model is in the form of a tree, and in the text representation lines that start with goal or solution correspond to nodes of this tree. The lines immediately under and indented from a goal or solution line are the corresponding node's contents.
NOTE: There are also
assumption,context, andjustificationnodes in the GSN model, but they are not tree nodes. They are associated with tree nodes, i.e. are part of their contents, but they
are not internal or leaf nodes of the tree.
NOTE:
Goalsin an assurance case are also calledClaims.
The Language Server
NOTE: Do not make the modifications to the GSN model text in this section of the tutorial.
These modifications are shown only for demonstration.
One feature of CAID is that, when editing the text representation of a GSN model, a language server will indicate the locations of syntax errors and suggest completions for words when Ctrl-SPACE is pressed on the keyboard, as indicated by the red arrows in the figure below: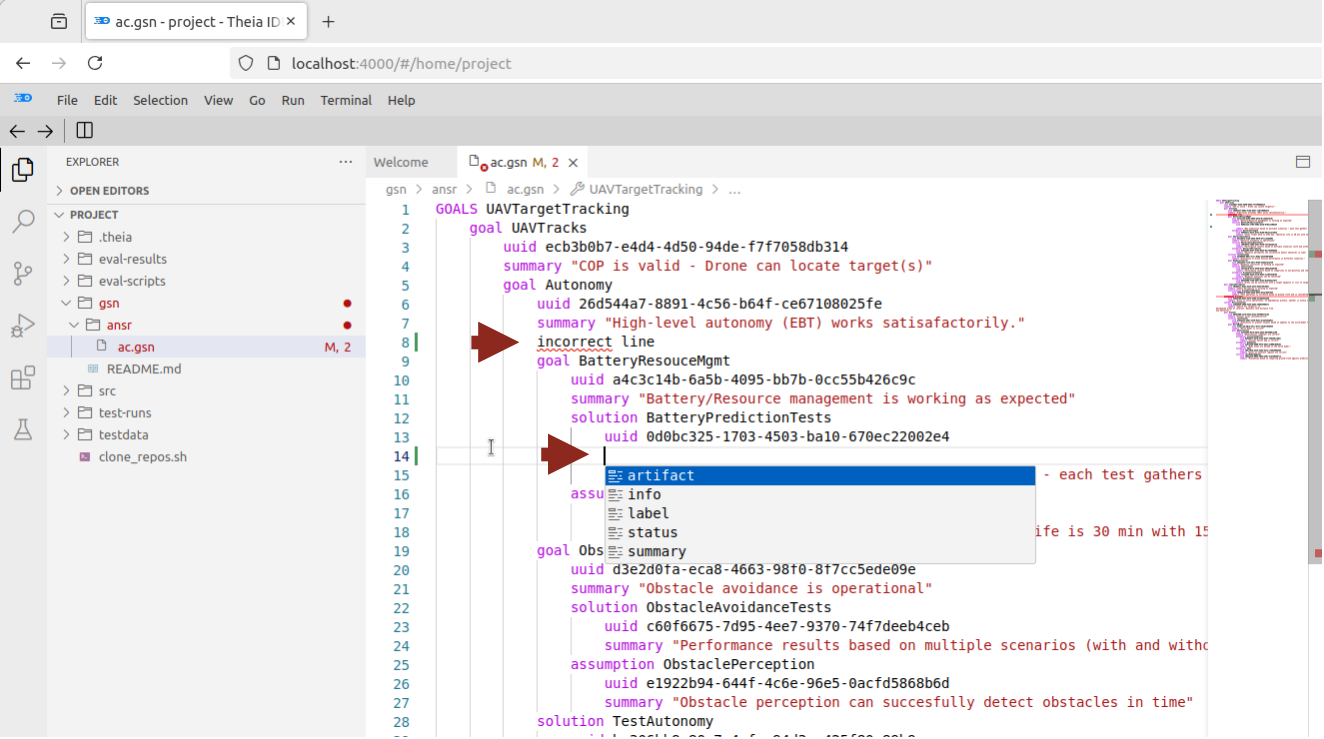
Suggestions also appear after you type one or more characters: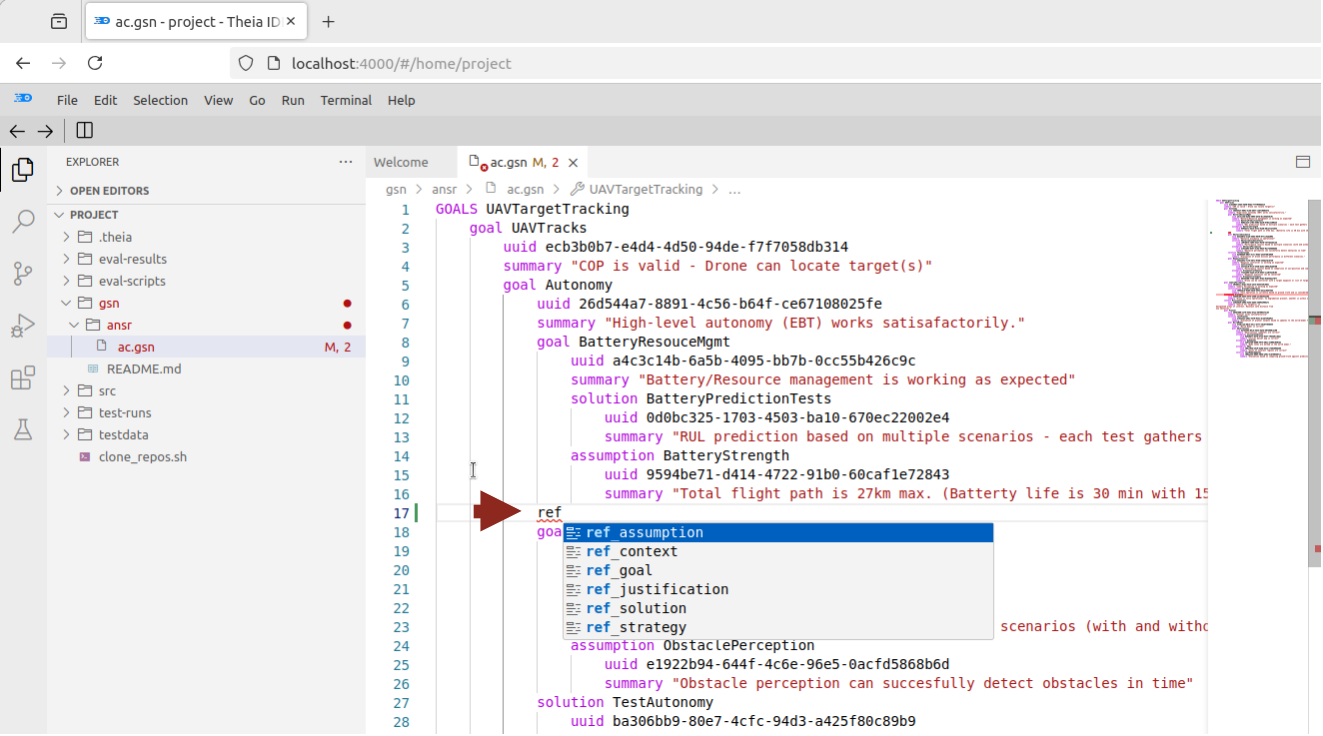
NOTE: Do not make the above modifications. If you did, please undo them. They are shown only for
demonstration.
The Graph Representation of GSN models
To see a graphical depiction of this GSN model, click on the![]()
at the top right of the browser window as was done to launch the Depi Server above, and in the resulting text field, enter the following text and press the <enter> key:>GSN: Graph View
NOTE: Again, the right chevron
>in the above text is VERY IMPORTANT.
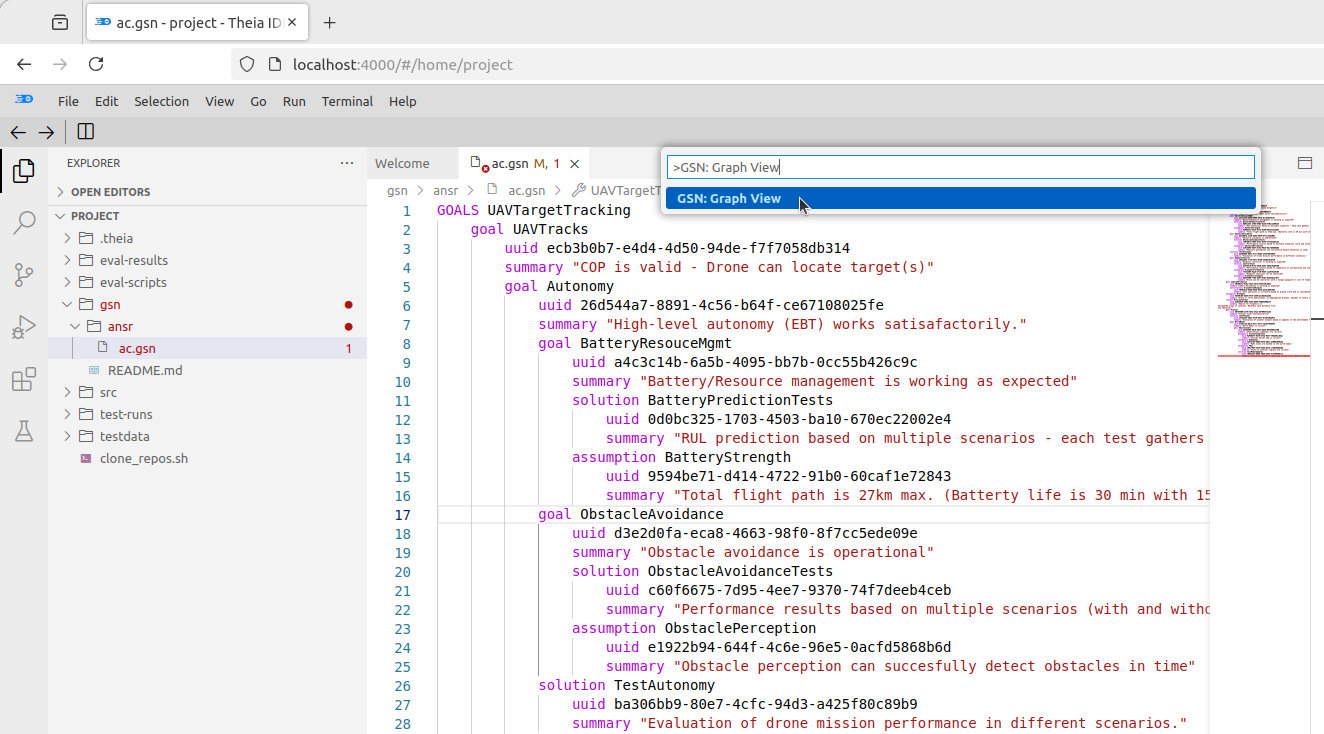
The GSN Graph View will appear in the left sub-pane of the Editor pane: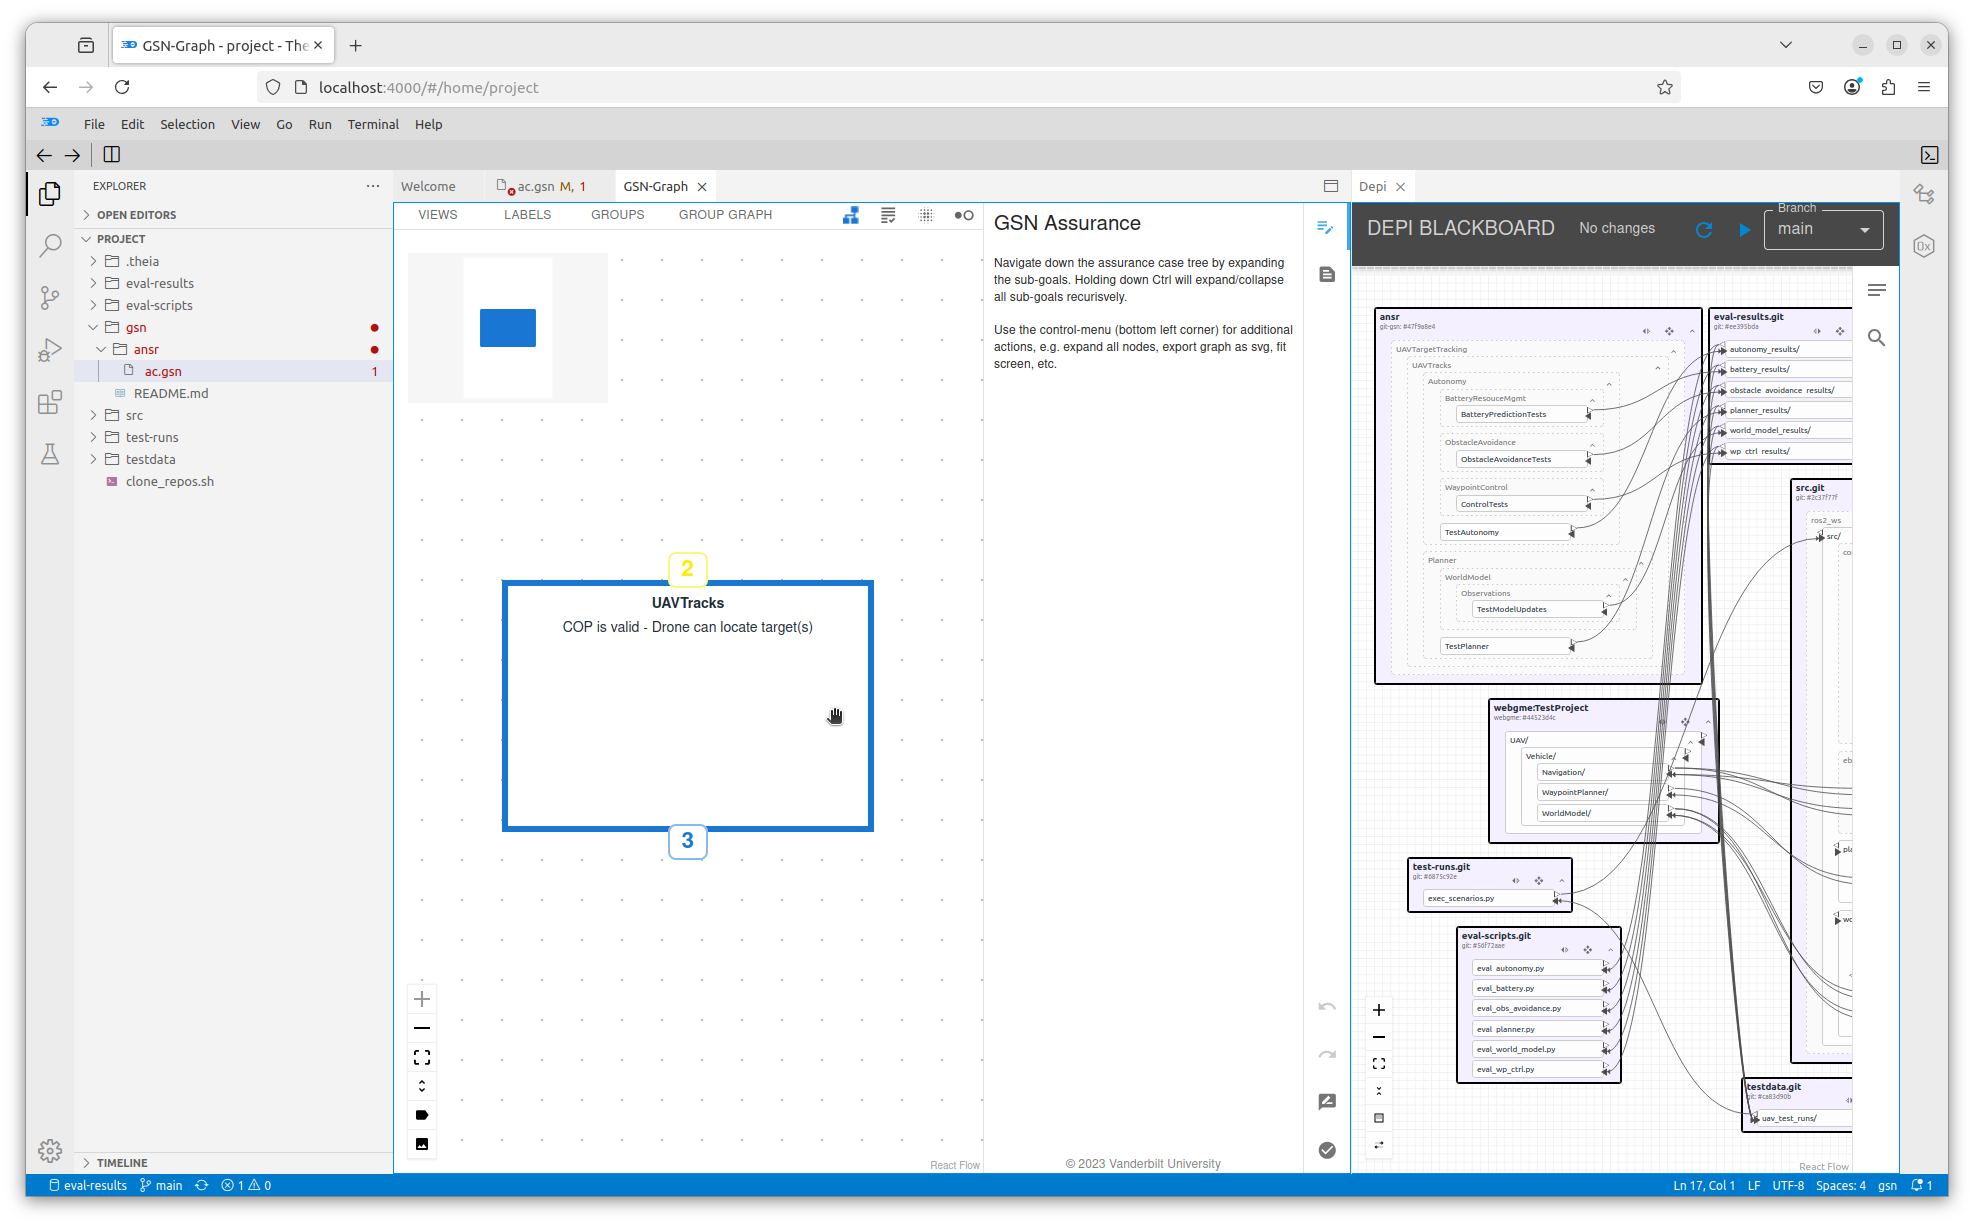
To make more room for the GSN model graph, click on the Info button![]()
at the upper right corner of this sub-pane: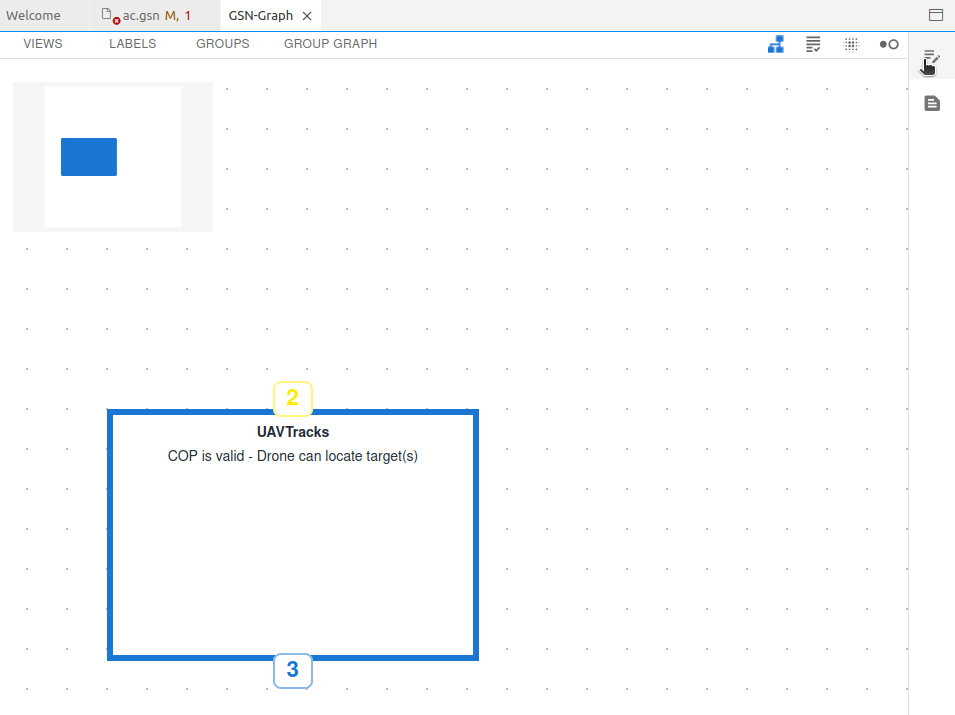
What is shown is not the whole tree of the GSN model, but only the root node. For this or any node displayed in the graph view, the upper yellow number indicates the number of assumptions, contexts, and justifications for the node. The lower blue number indicates the number of children, i.e. sub-goals and solutions, the node has. The graph view is interactive, so to see the assumptions and contexts, click on the yellow number: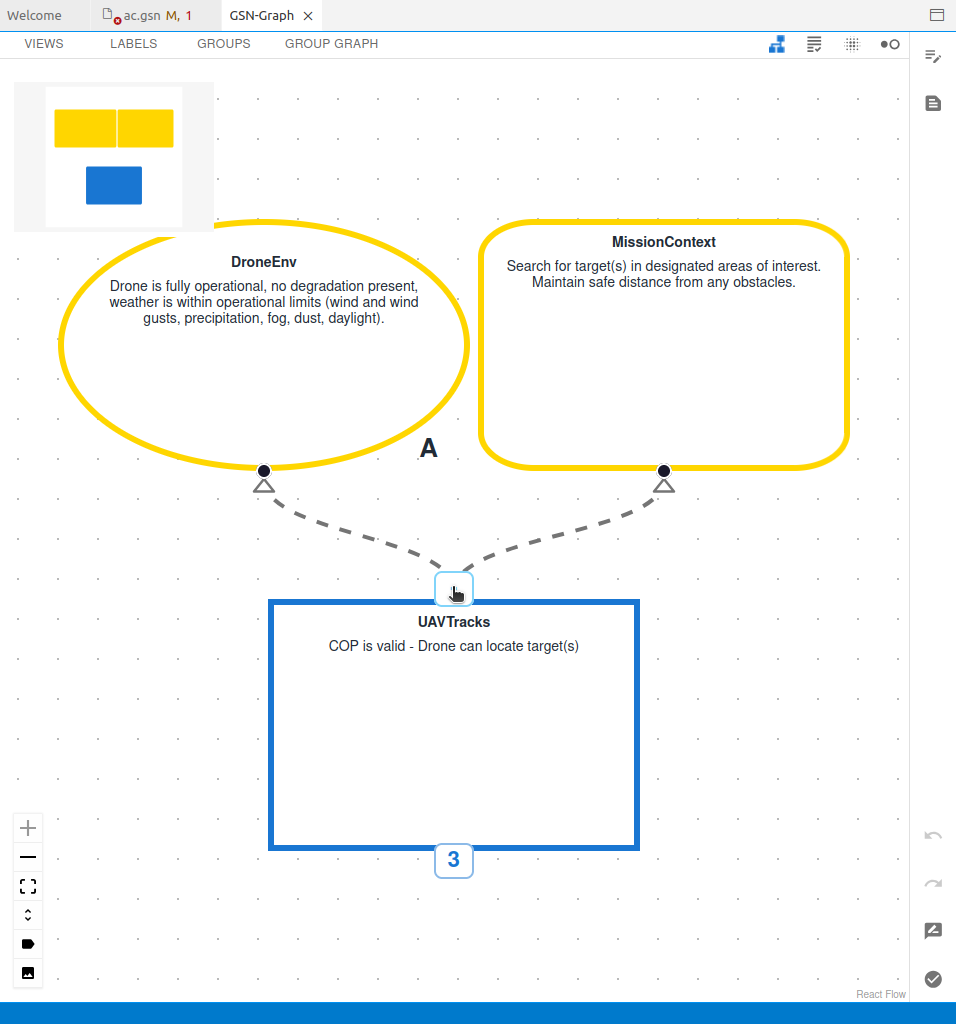
Click on the same spot (now cyan with a dash - in it) to hide the assumptions and contexts.
To see the node's children, click on the blue number:
As with the assumptions, you can click on the same spot to hide the children.
To see the entire tree of the GSN model, click on the Expand Tree button
(![]() )
)
at the lower left corner of the Editor pane: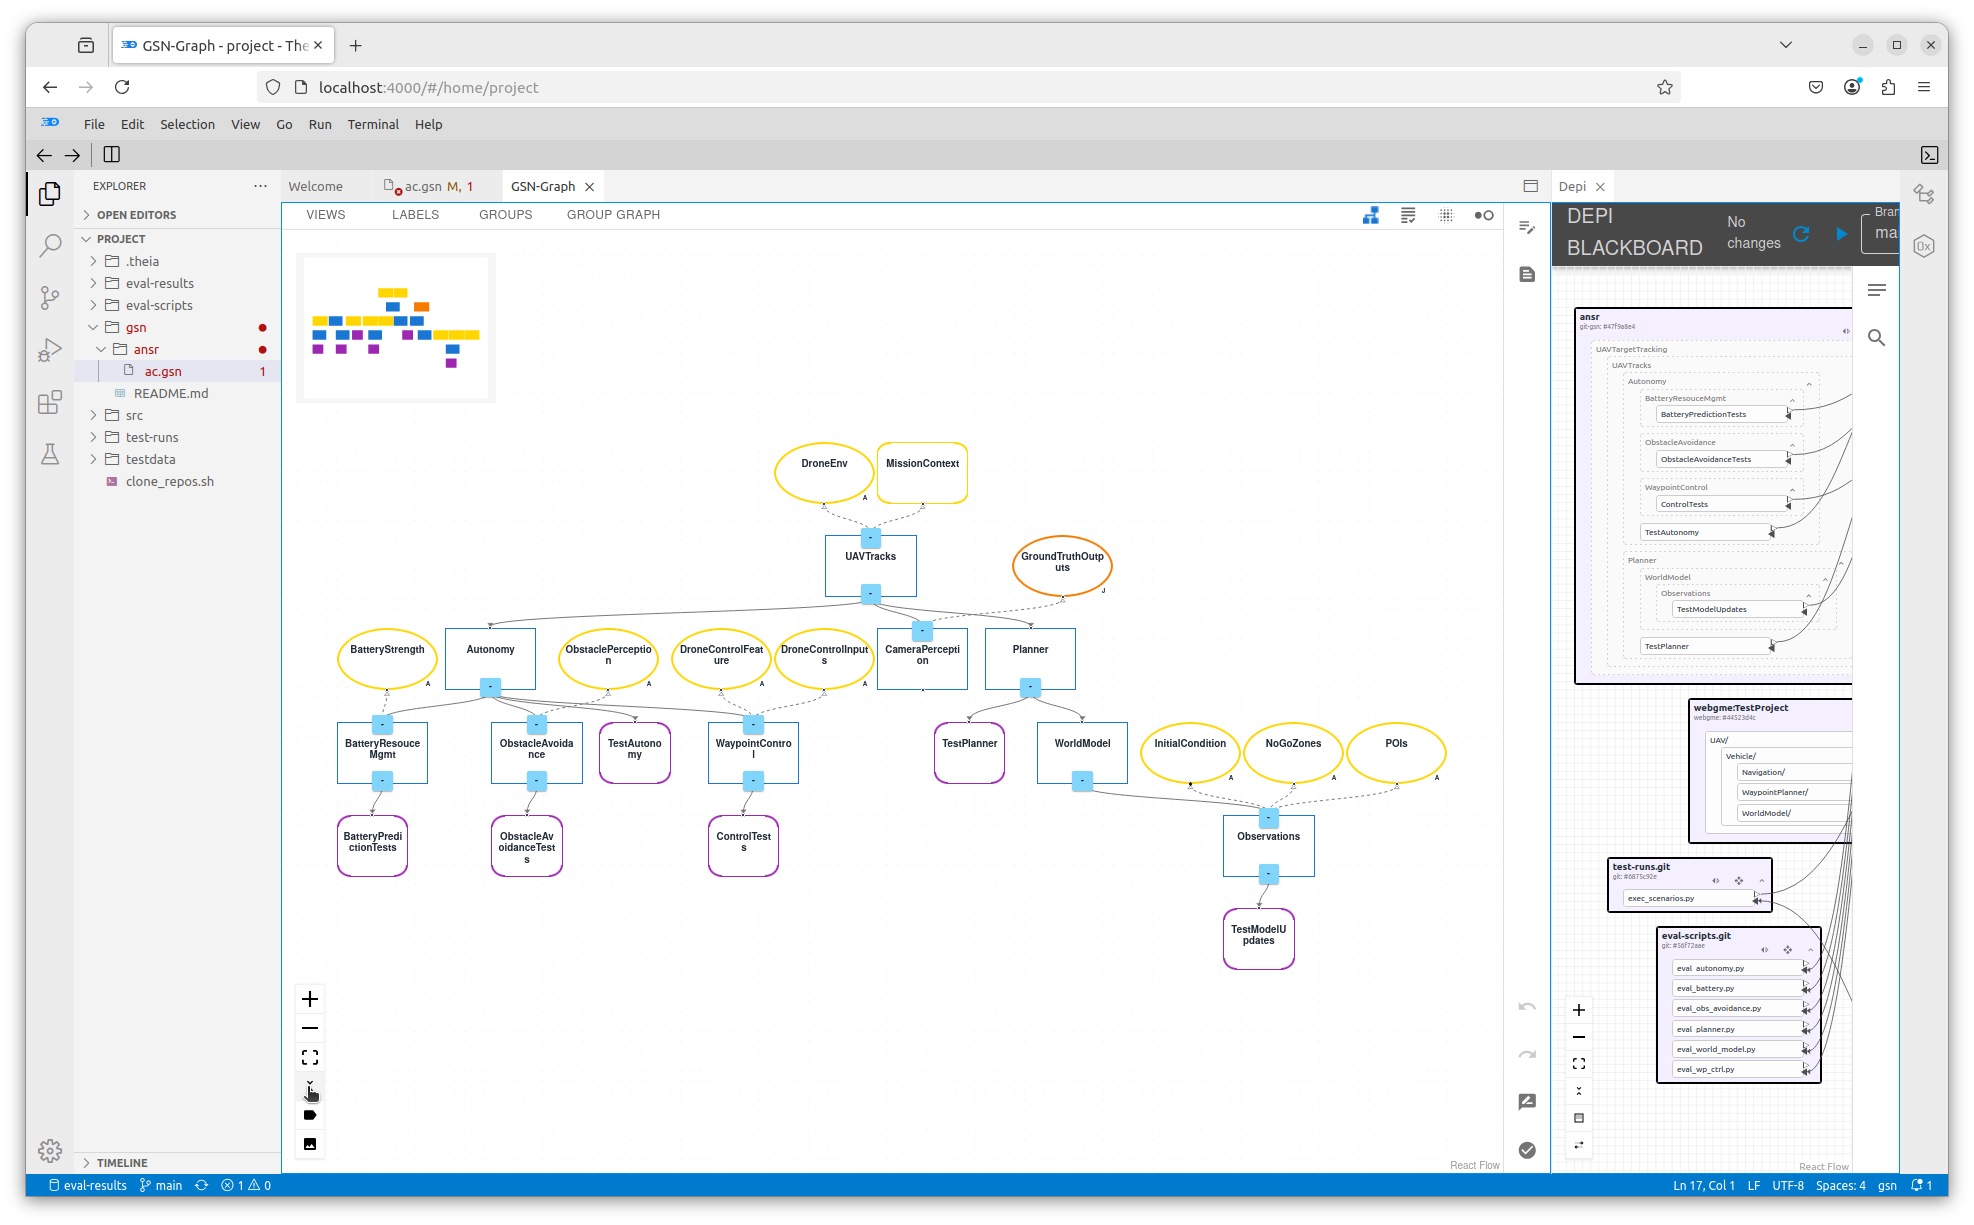
In this model, a solution node (purple rectangle) represents evidence that supports their parent goal (claim) node. One or more goal nodes that are siblings in the tree support their parent goal node. The desired end state is that all goals are supported by solutions or other goals all the way up to the root goal. At this point, the reliability of the system is proven.
The types of nodes in the graph are as follows:
| Node type | Description |
|---|---|
| Assumption | Yellow ellipse |
| Context | Yellow rectangle with rounded corners |
| Justification | Orange Ellipse |
| Goal | Blue rectangle |
| Solution | Purple rectangle with rounded corners |
Alternate Views of the GSN Model
The tree view is one of several views that are available for the GSN model using CAID. The others are presented below.
Table view
To see the table view of the GSN model, click on the Review Table button![]() near the
near the
right top corner of the Editor pane:
You can see a table of goals (claims) for this GSN model, or, as can be seen in the upper right corner of this view, by clicking the selector button for Solution you can see a table of solutions.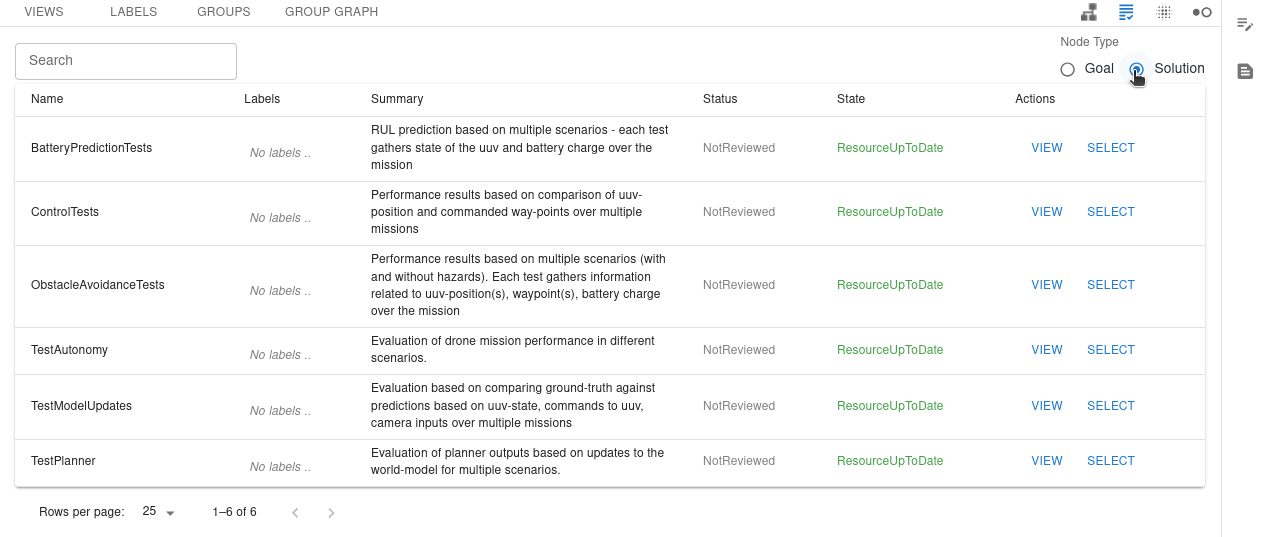
Radial View
The radial view of the GSN model can be seen by clicking on the Radial Visualization button![]()
to the right of the Review Table button: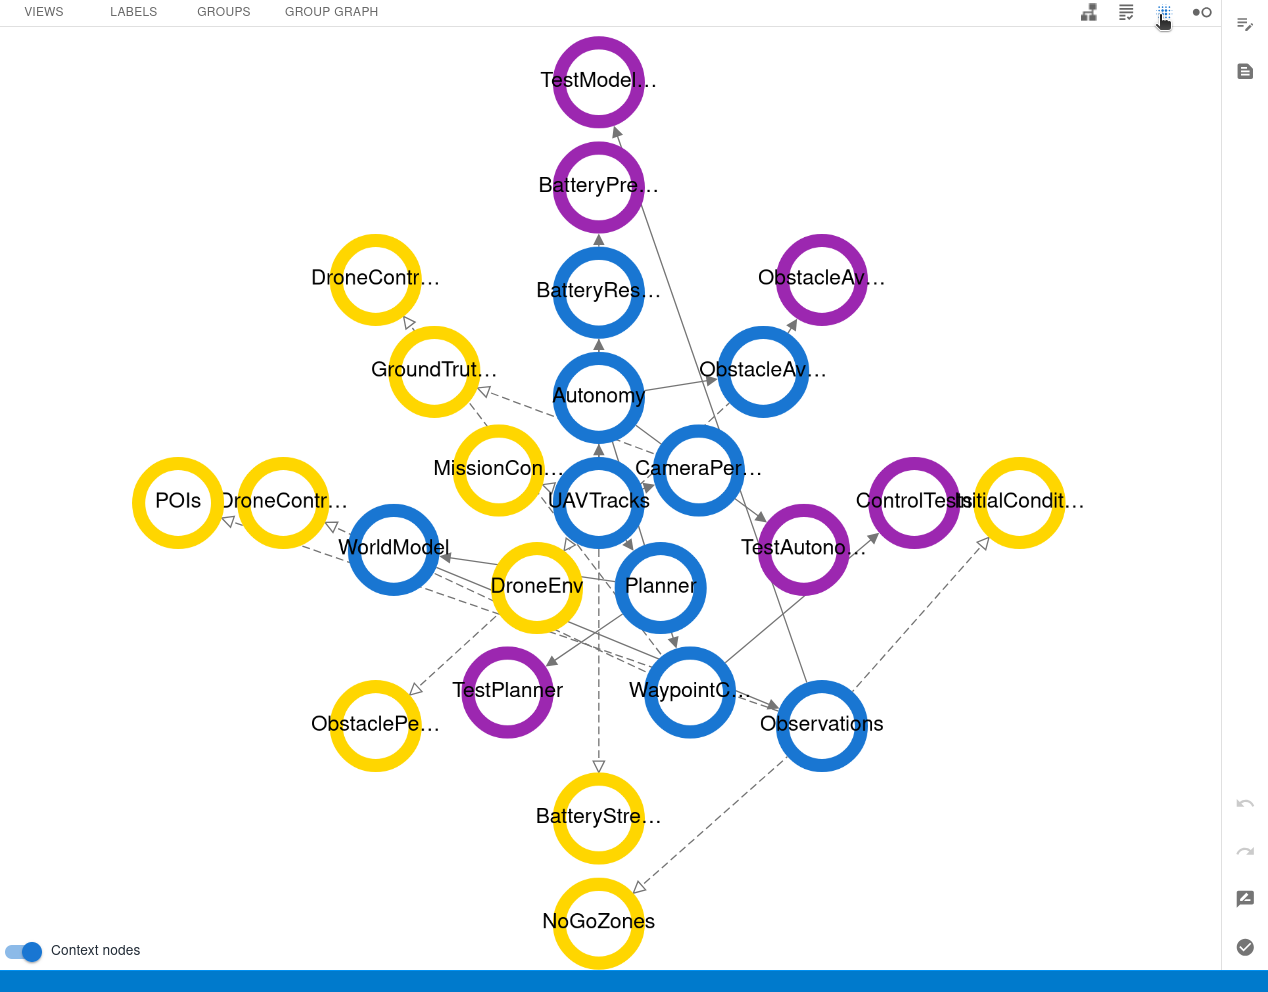
In this view, the root node of the GSN model is in the middle, and the descendant nodes radiate out from the root node.
Cluster View
To see the cluster view of the GSN mode, click on the Cluster Visualization button![]()
to right of the Radial Visualization button: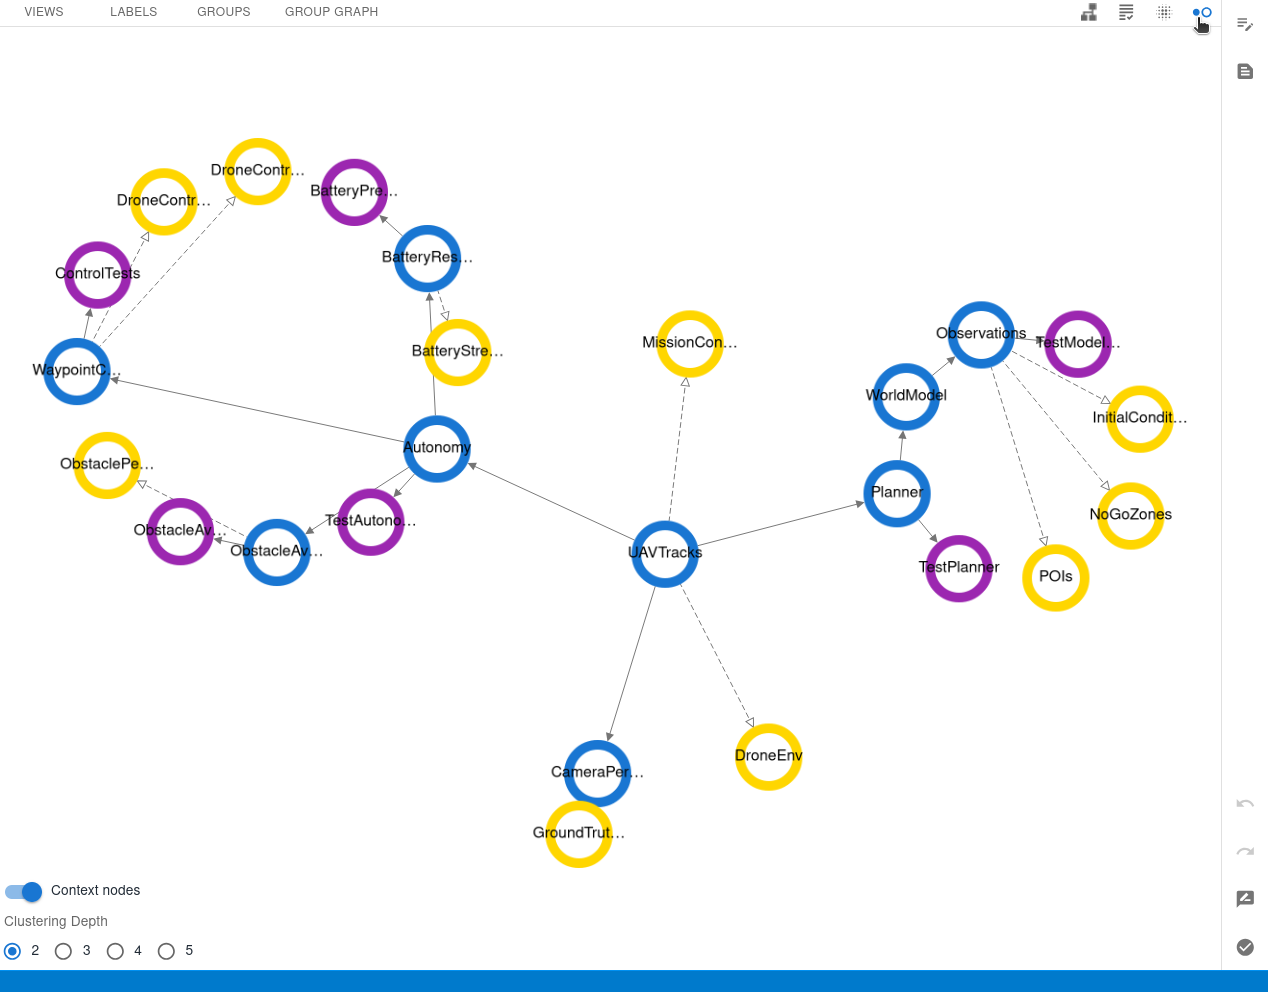
The cluster view is similar to the radial view inasmuch as the root node of the GSN model is displayed in the middle, and the descendant nodes radiate out from the root node. However, the descendant nodes at a given selectable depth, are displayed in circular clusters. The default Clustering Depth is 2, as shown in the above figure. However, you can select a different clustering depth at the lower left corner of the Editor pane. Below is a cluster view
of the GSN model with a clustering depth of 4: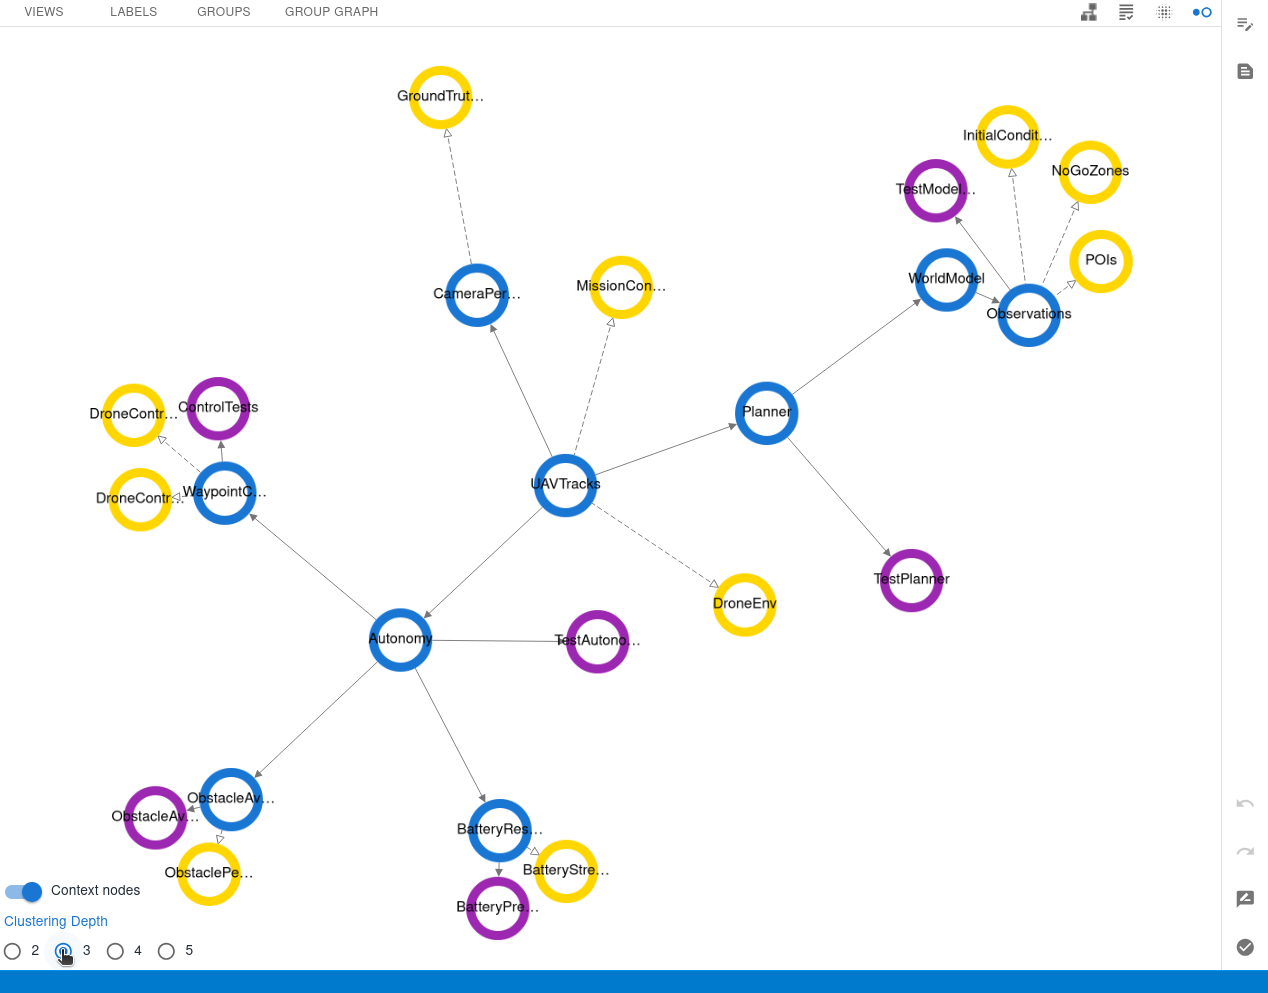
To get back to the tree view, click on the Tree Graph Visualization button![]()
to left of the Review Table button: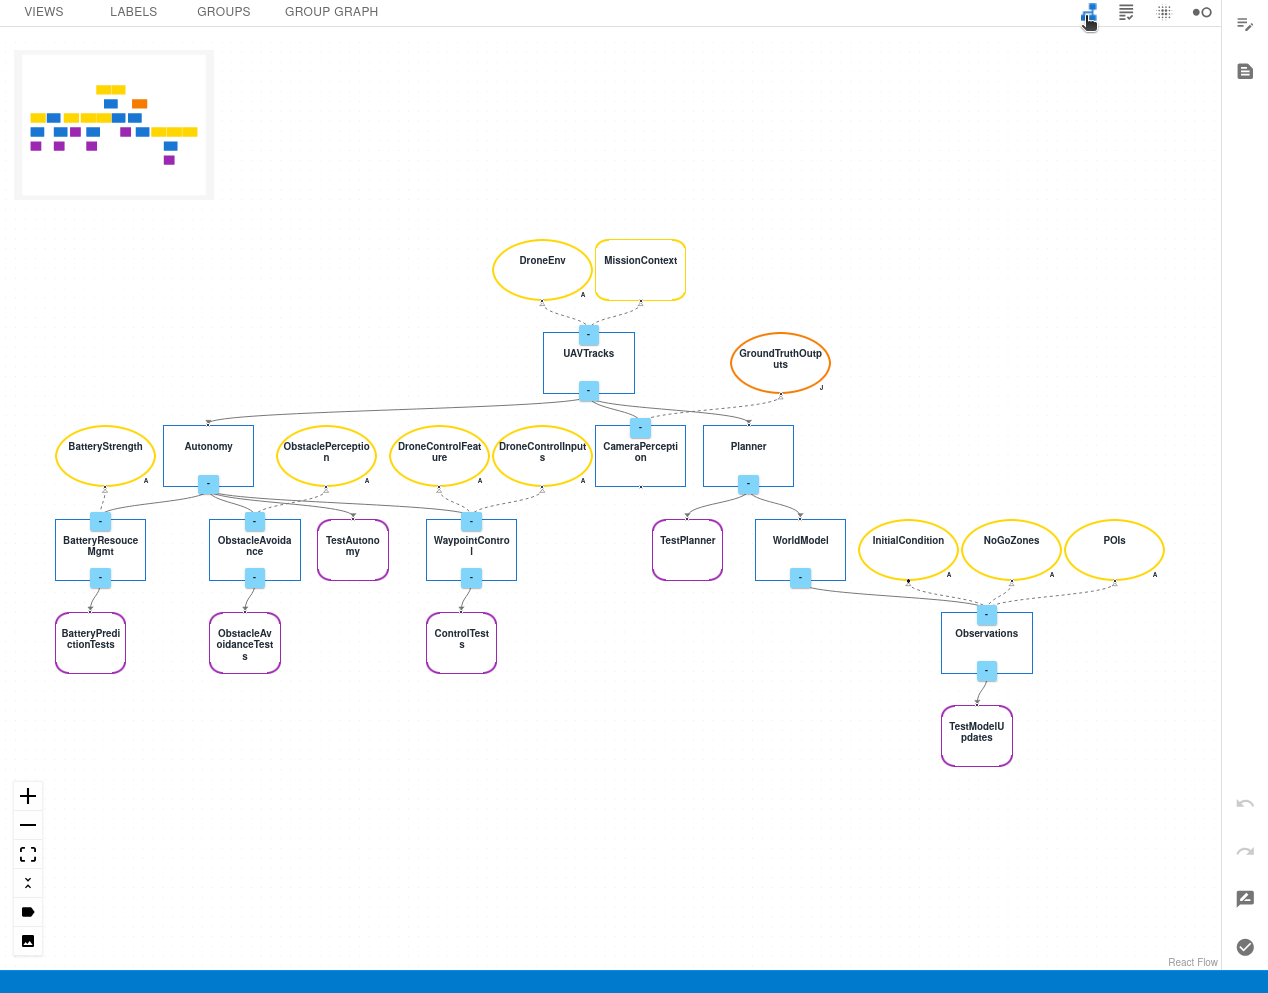
Synchrony between the Text and Graph Representations of the GSN Model
One feature of the text and graph representations of a GSN model in CAID is that modification in one will be reflected in the other. To demonstrate this, click on the ac.gsn tab at the top left of the Editor pane to go back to the text representation of the GSN model. Then, scroll down to expose the WaypointControl node starting at line 29.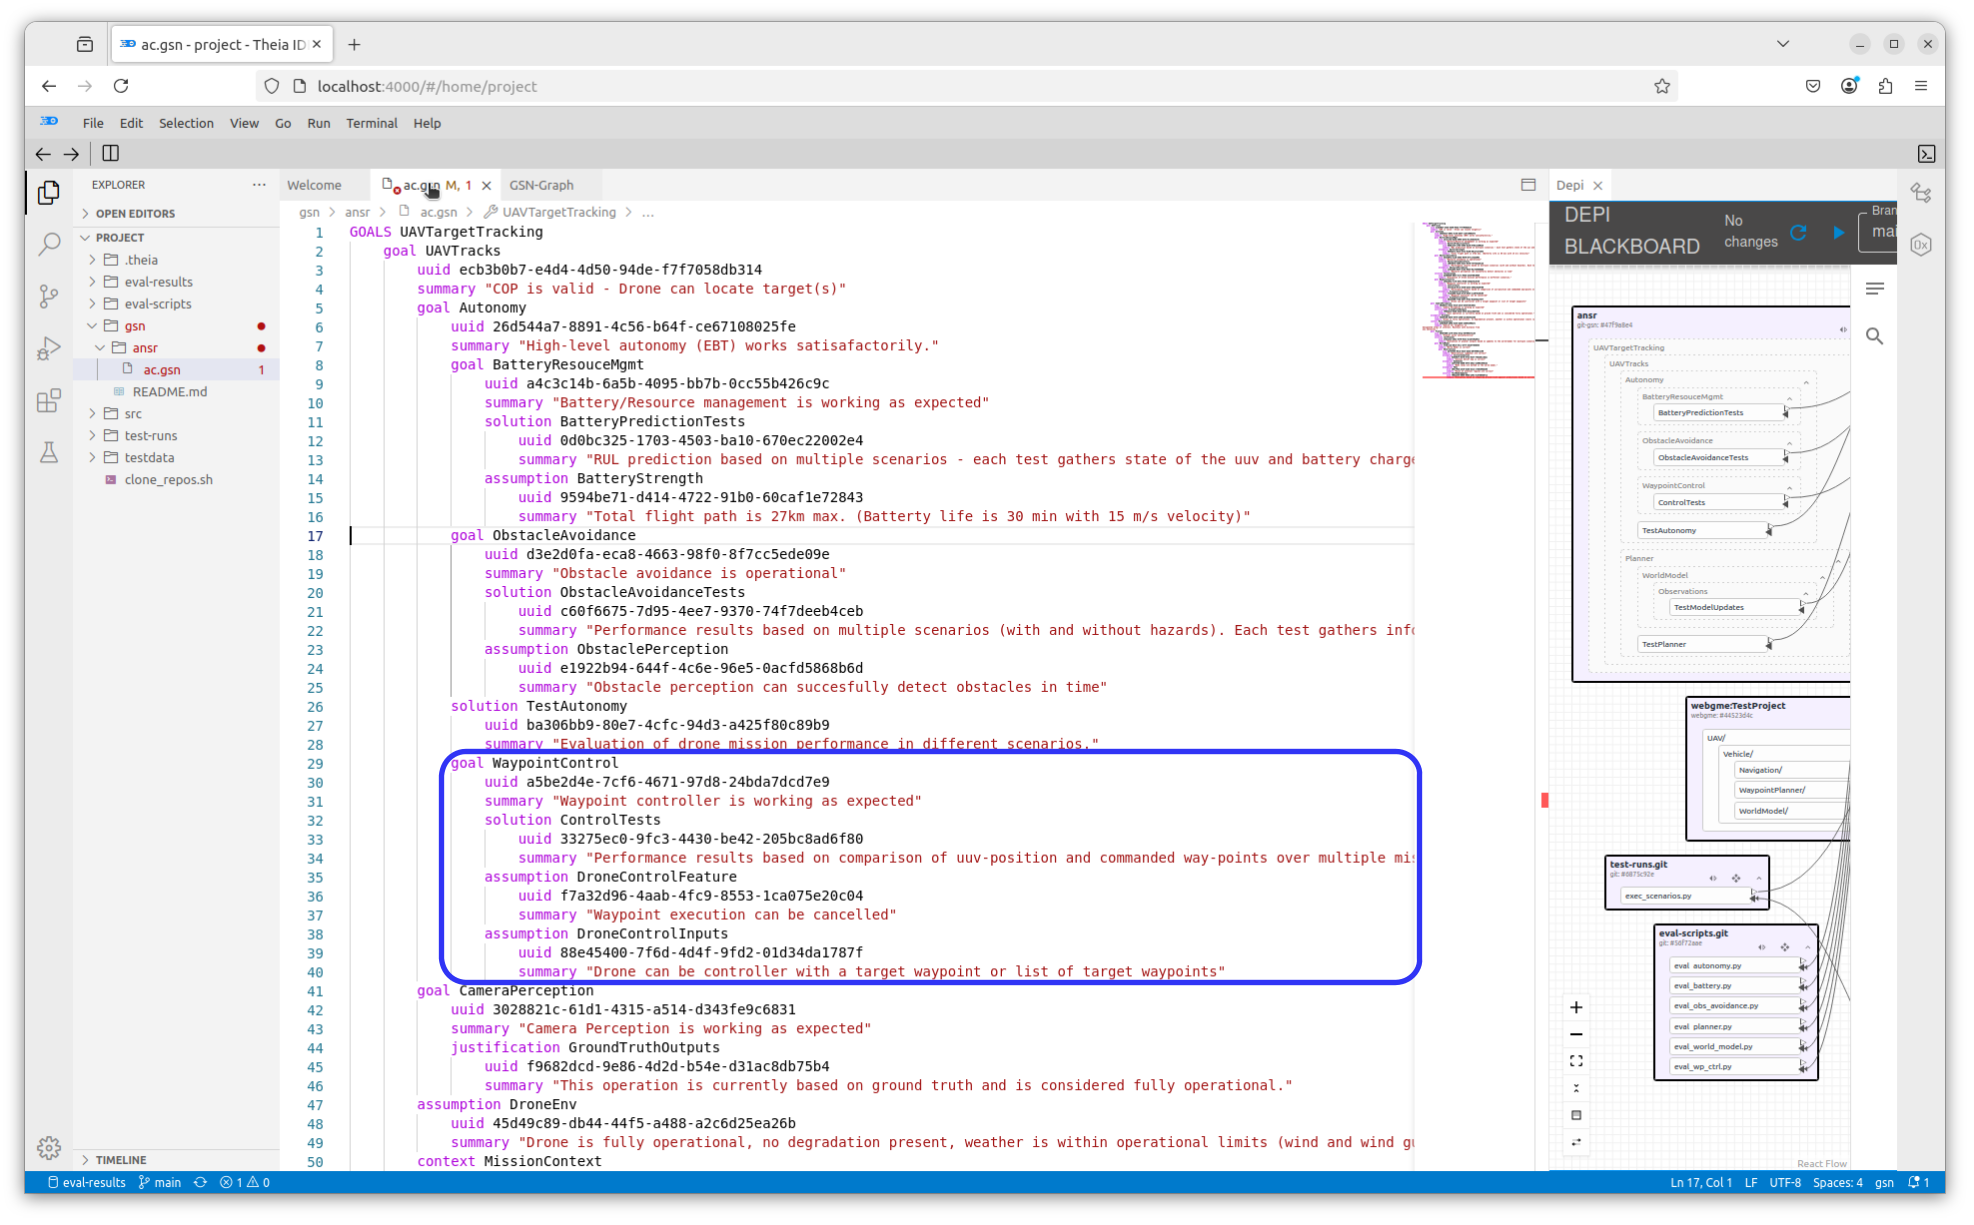
Now, click the GSN-Graph tab to show the graph representation again. Locate the WaypointControl node, and click on it with your primary mouse button so that it is highlighted: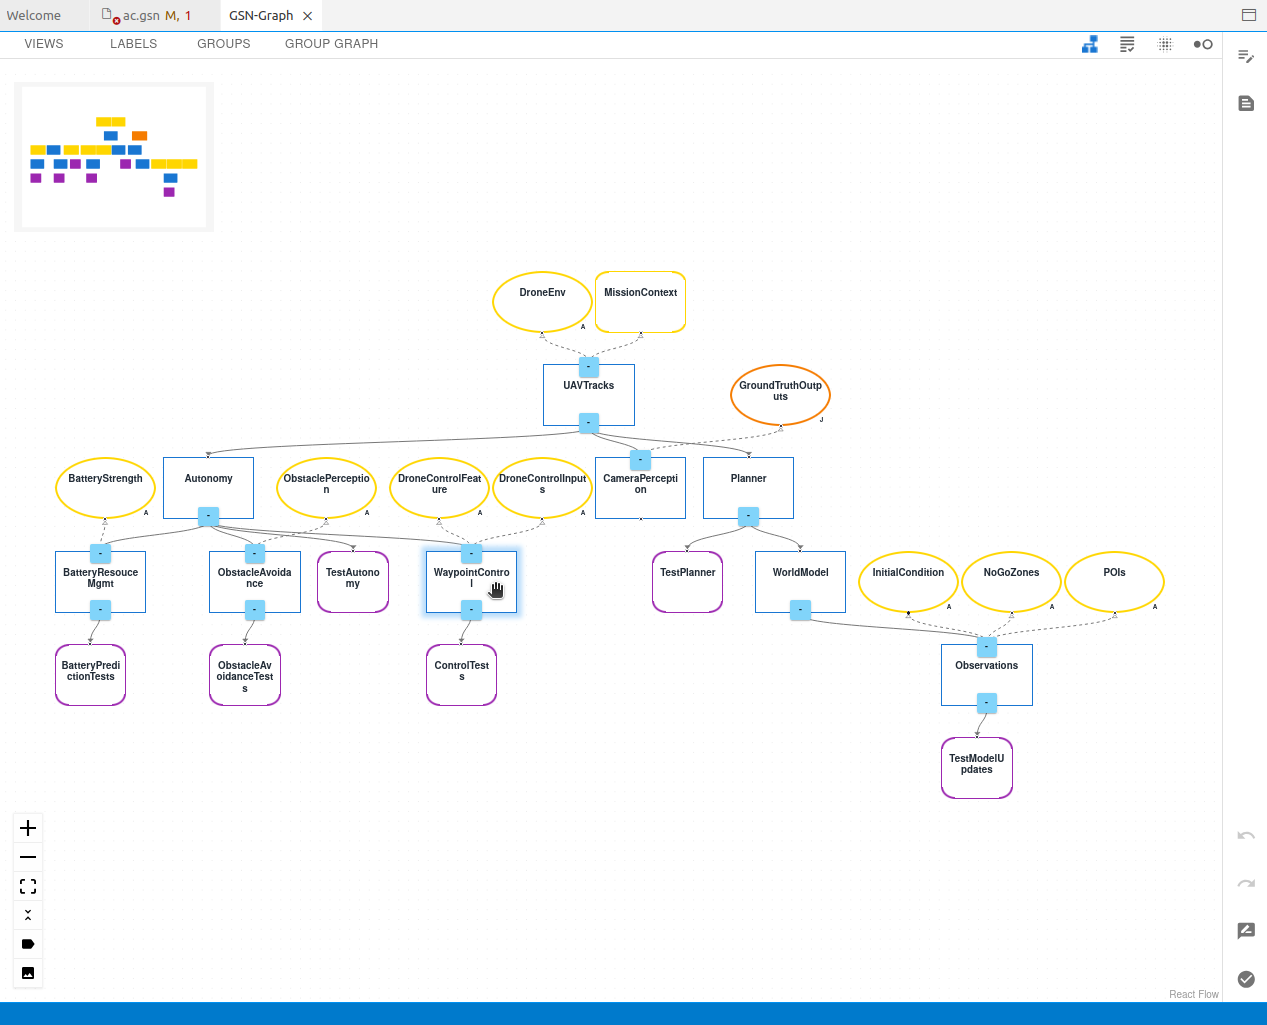
Then click on the info button![]()
at the upper right corner of the Graph View.
A sub-pane pertaining to the WaypointControl node will appear on the right of the Graph View: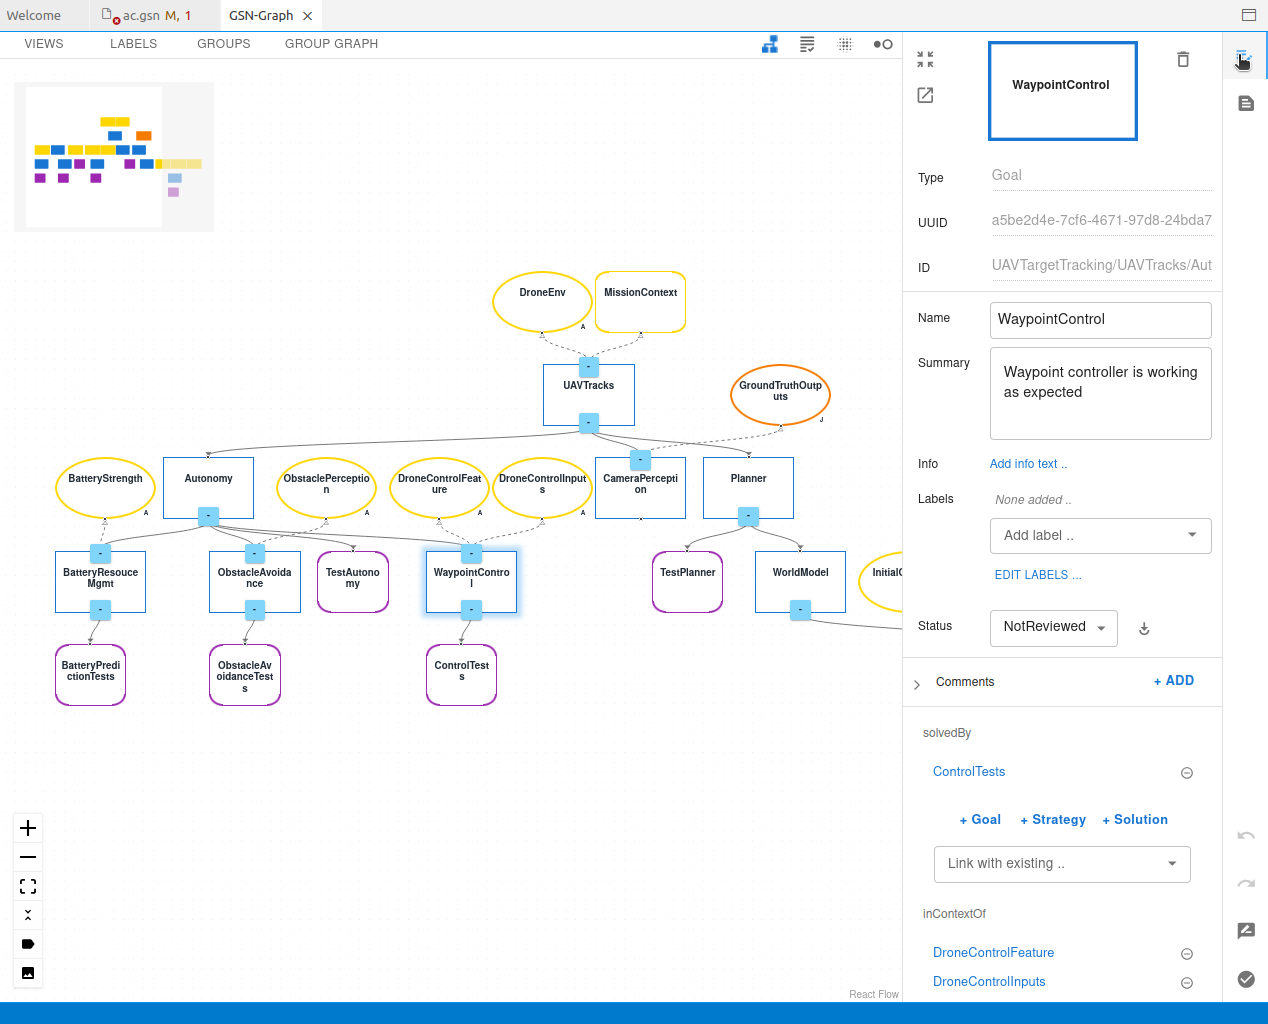
Scroll down to the bottom of this sub-pane and click on + Goal. A new goal (blue rectangle) labeled G1 will appear below the WaypointControl node in the Graph View: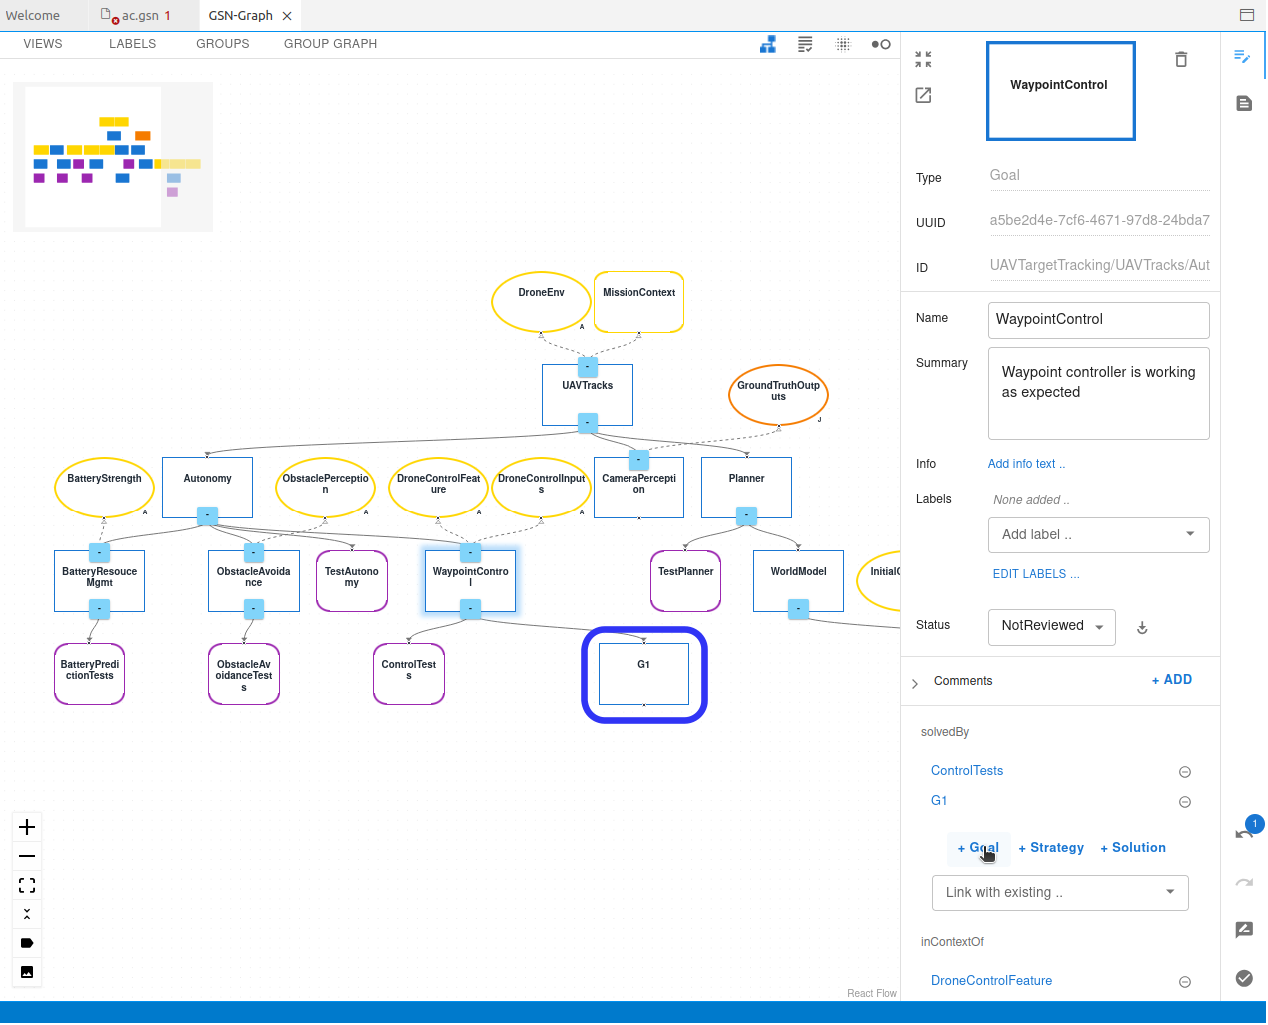
Clicking again on the ac.gsn tab, we see in the text representation that a new goal called G1 has appeared in the contents of the WaypointControl node: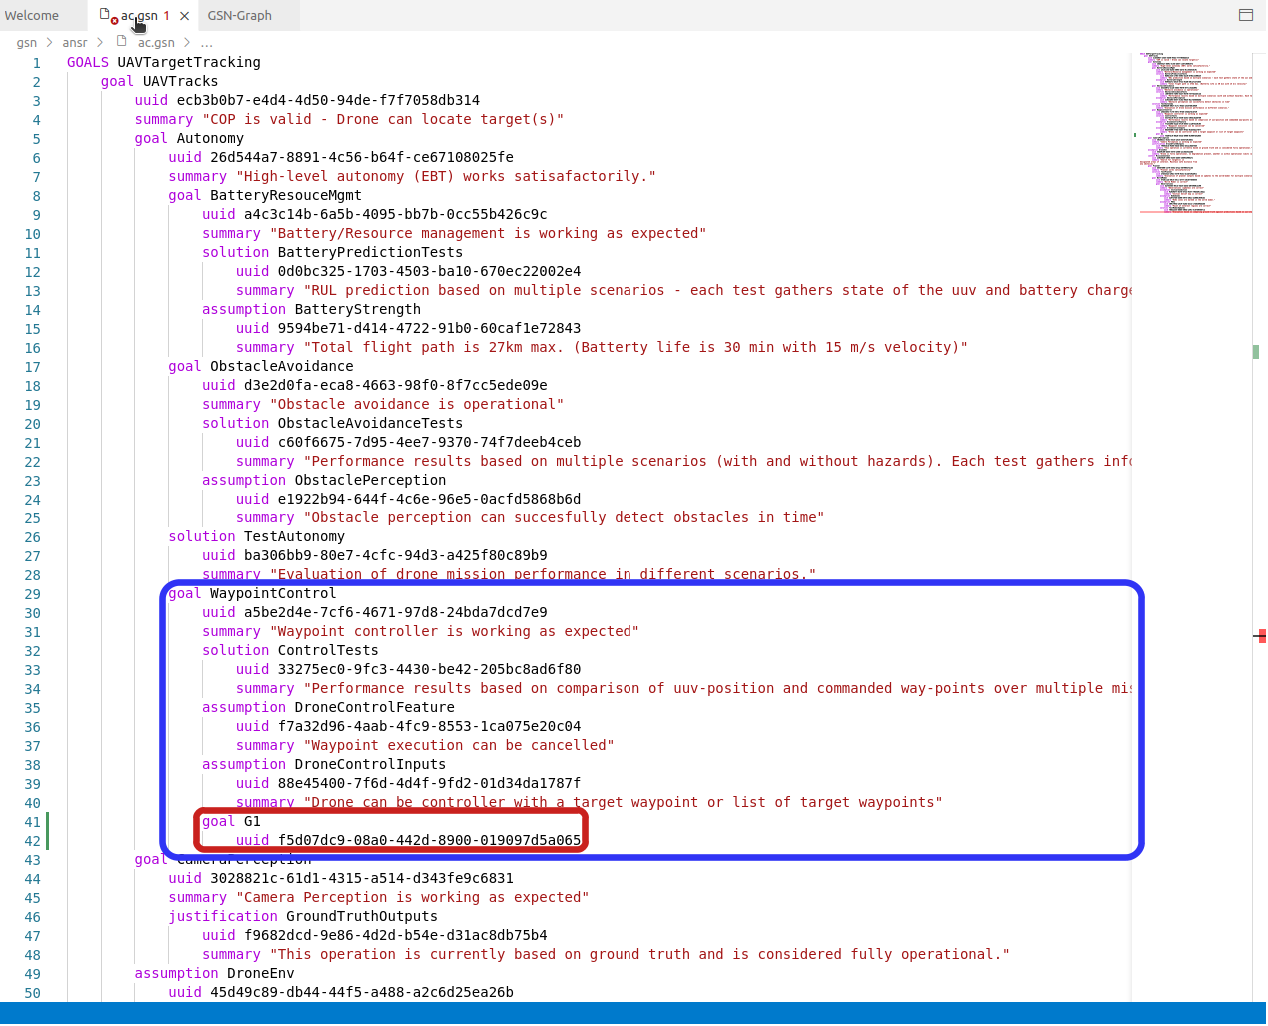
Select this new G1 goal and its contents with your mouse and press the delete key on your keyboard to delete it: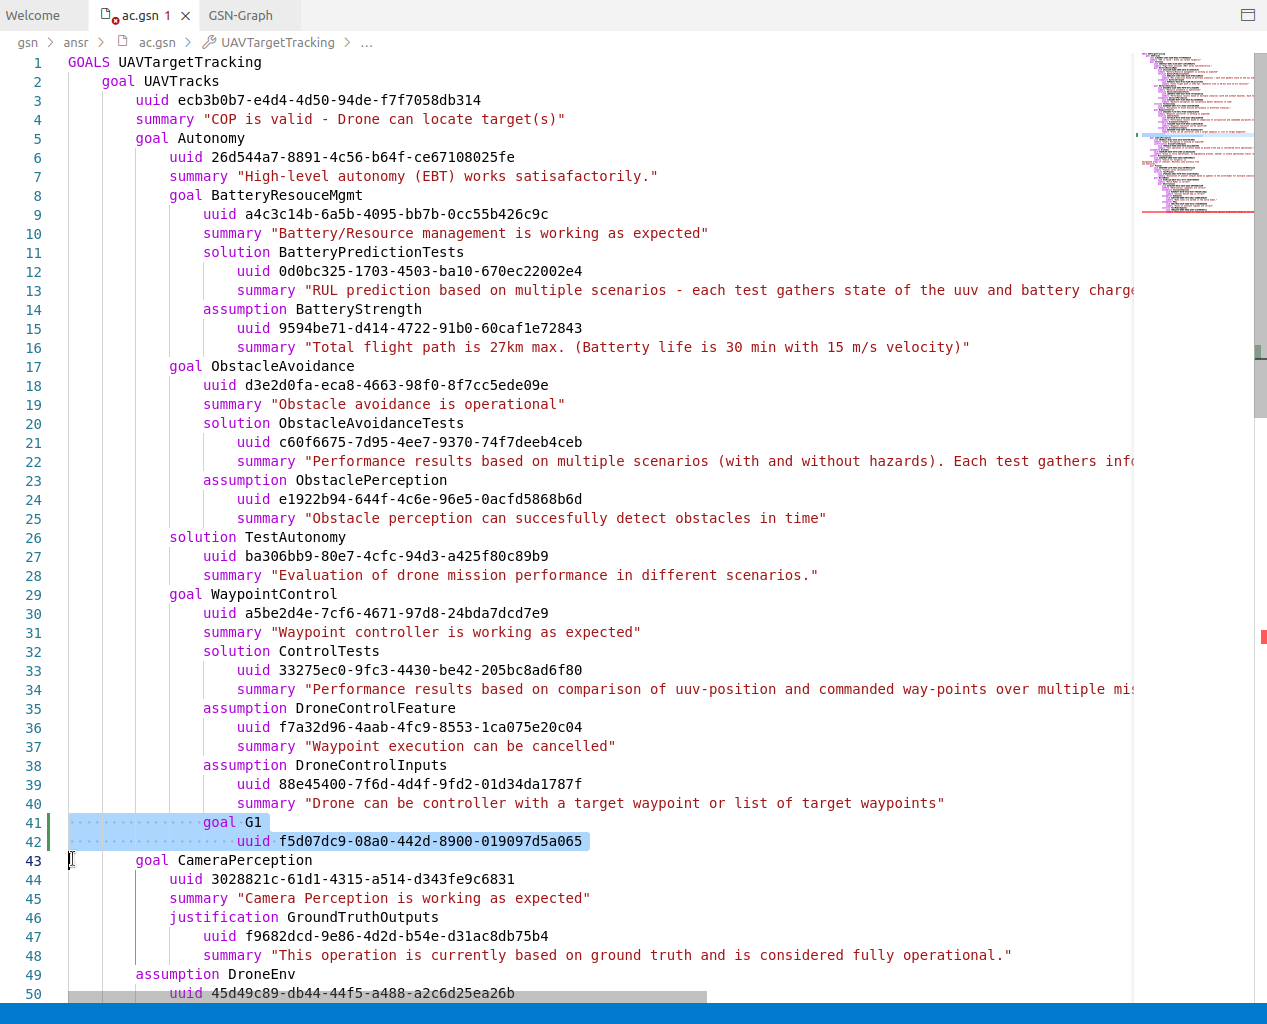
Select the GSN-Graph tab again, and notice the G1 goal has been deleted from the tree as well.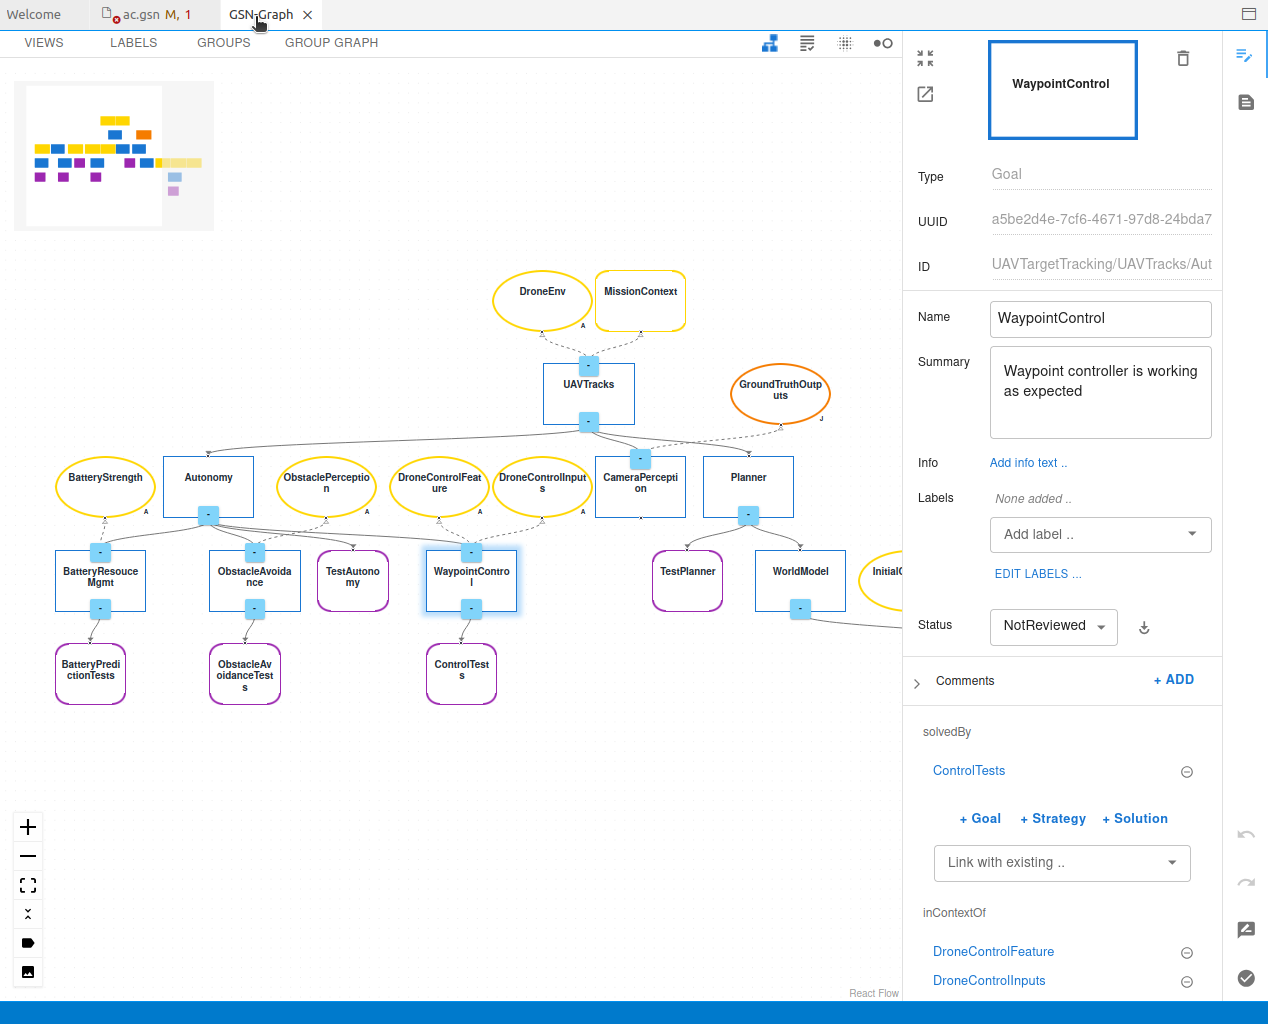
Working with Dependencies
In a GSN model for proving the functionality and safety of a control system, called an assurance case, the solution (leaf) nodes provide evidence of the reliability of some component of the system. However, this evidence is generally not contained in the GSN model itself. Rather, the solution node is a representation of this evidence, and the evidence is stored elsewhere. Thus, there is a dependency between the GSN model solution node and its evidence: if the evidence changes, the solution node must be updated.
Furthermore, there are resources, i.e. data and programs, that are used to generate the evidence, and thus a dependency between the evidence and these resources -- if one or more of these resources change, the evidence must change (i.e. be updated). These resources are stored in still other locations. CAID keeps track of these dependencies, and using the facilities of CAID, we can find all of the dependencies of a particular resource in our project. Also, CAID will flag a resource if any of its dependencies change. This is to remind a developer to review the resource and perform any updates to keep it in synchrony with its dependencies.
Finding the Dependencies of a Project Resource
In this section, we will find all of the dependencies of a particular resource in our project, and in particular
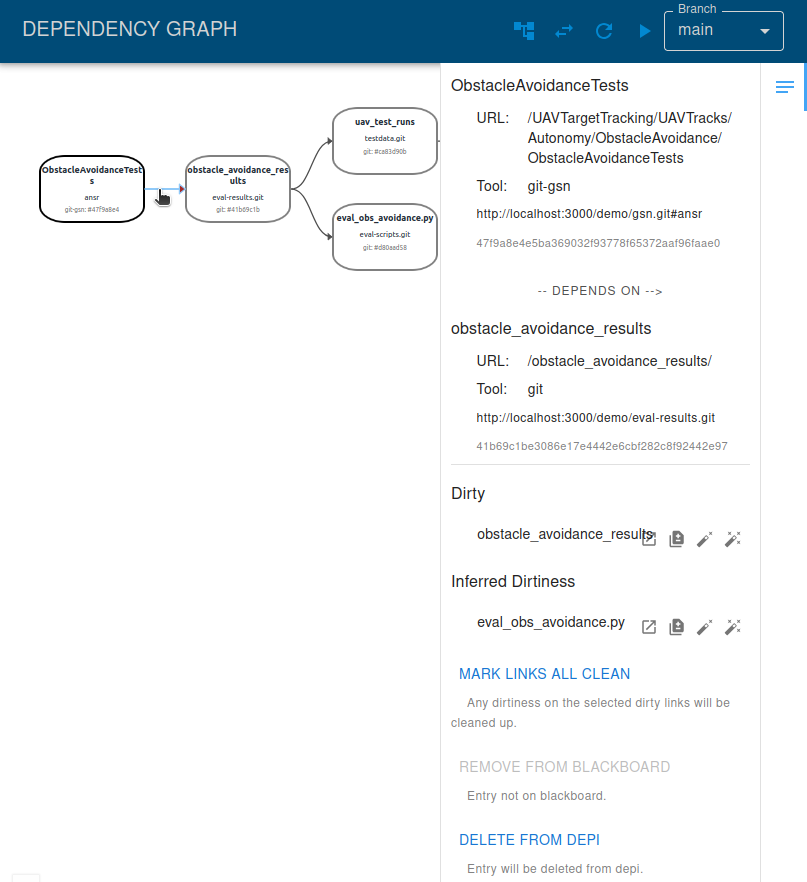
of a solution node in the gsn model. Firstly, make sure the GSN-Graph tab is selected in the left sub-pane of the Editor pane. Click on the ObstacleAvoidanceTests solution node in the GSN graph -- we will find the dependencies of this node.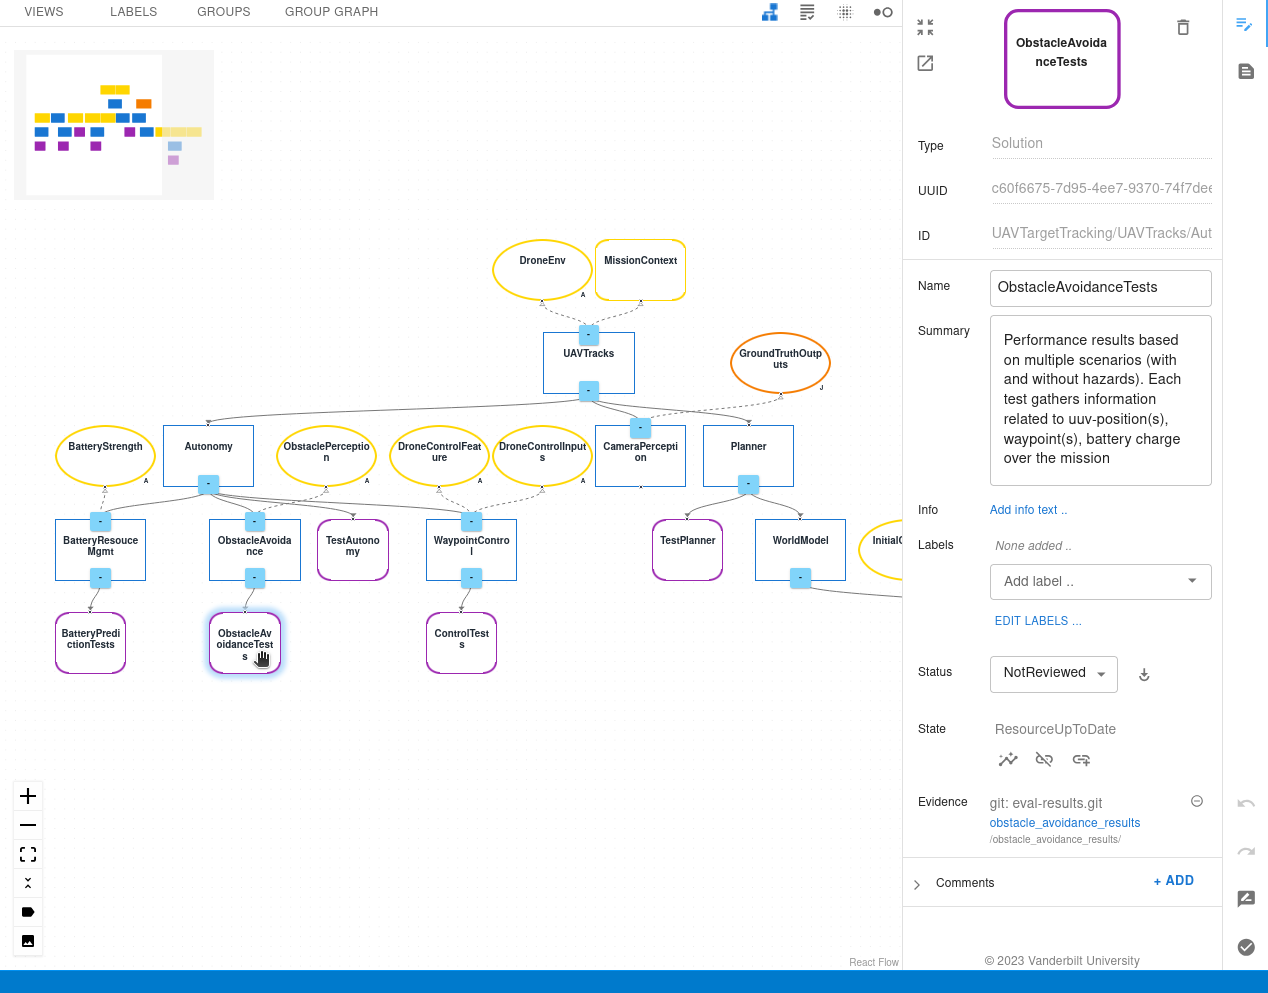
A sub-pane to the right of the graph should now contain information about the ObstacleAvoidanceTests
node.
NOTE: If the sub-pane is not visible, click on the
infobutton
at the upper right corner of Graph View.
NOTE: Scroll to the top of this sub-pane if needed to see that its information pertains to the
ObstacleAvoidanceTestsnode.
Scroll down to the bottom of this sub-pane to reveal the Show Dependency Graph button![]() .
.
Click on this button to display the dependency graph for the ObstacleAvoidanceTests solution node.
This graph will appear in its own sub-pane on the right of the Editor pane: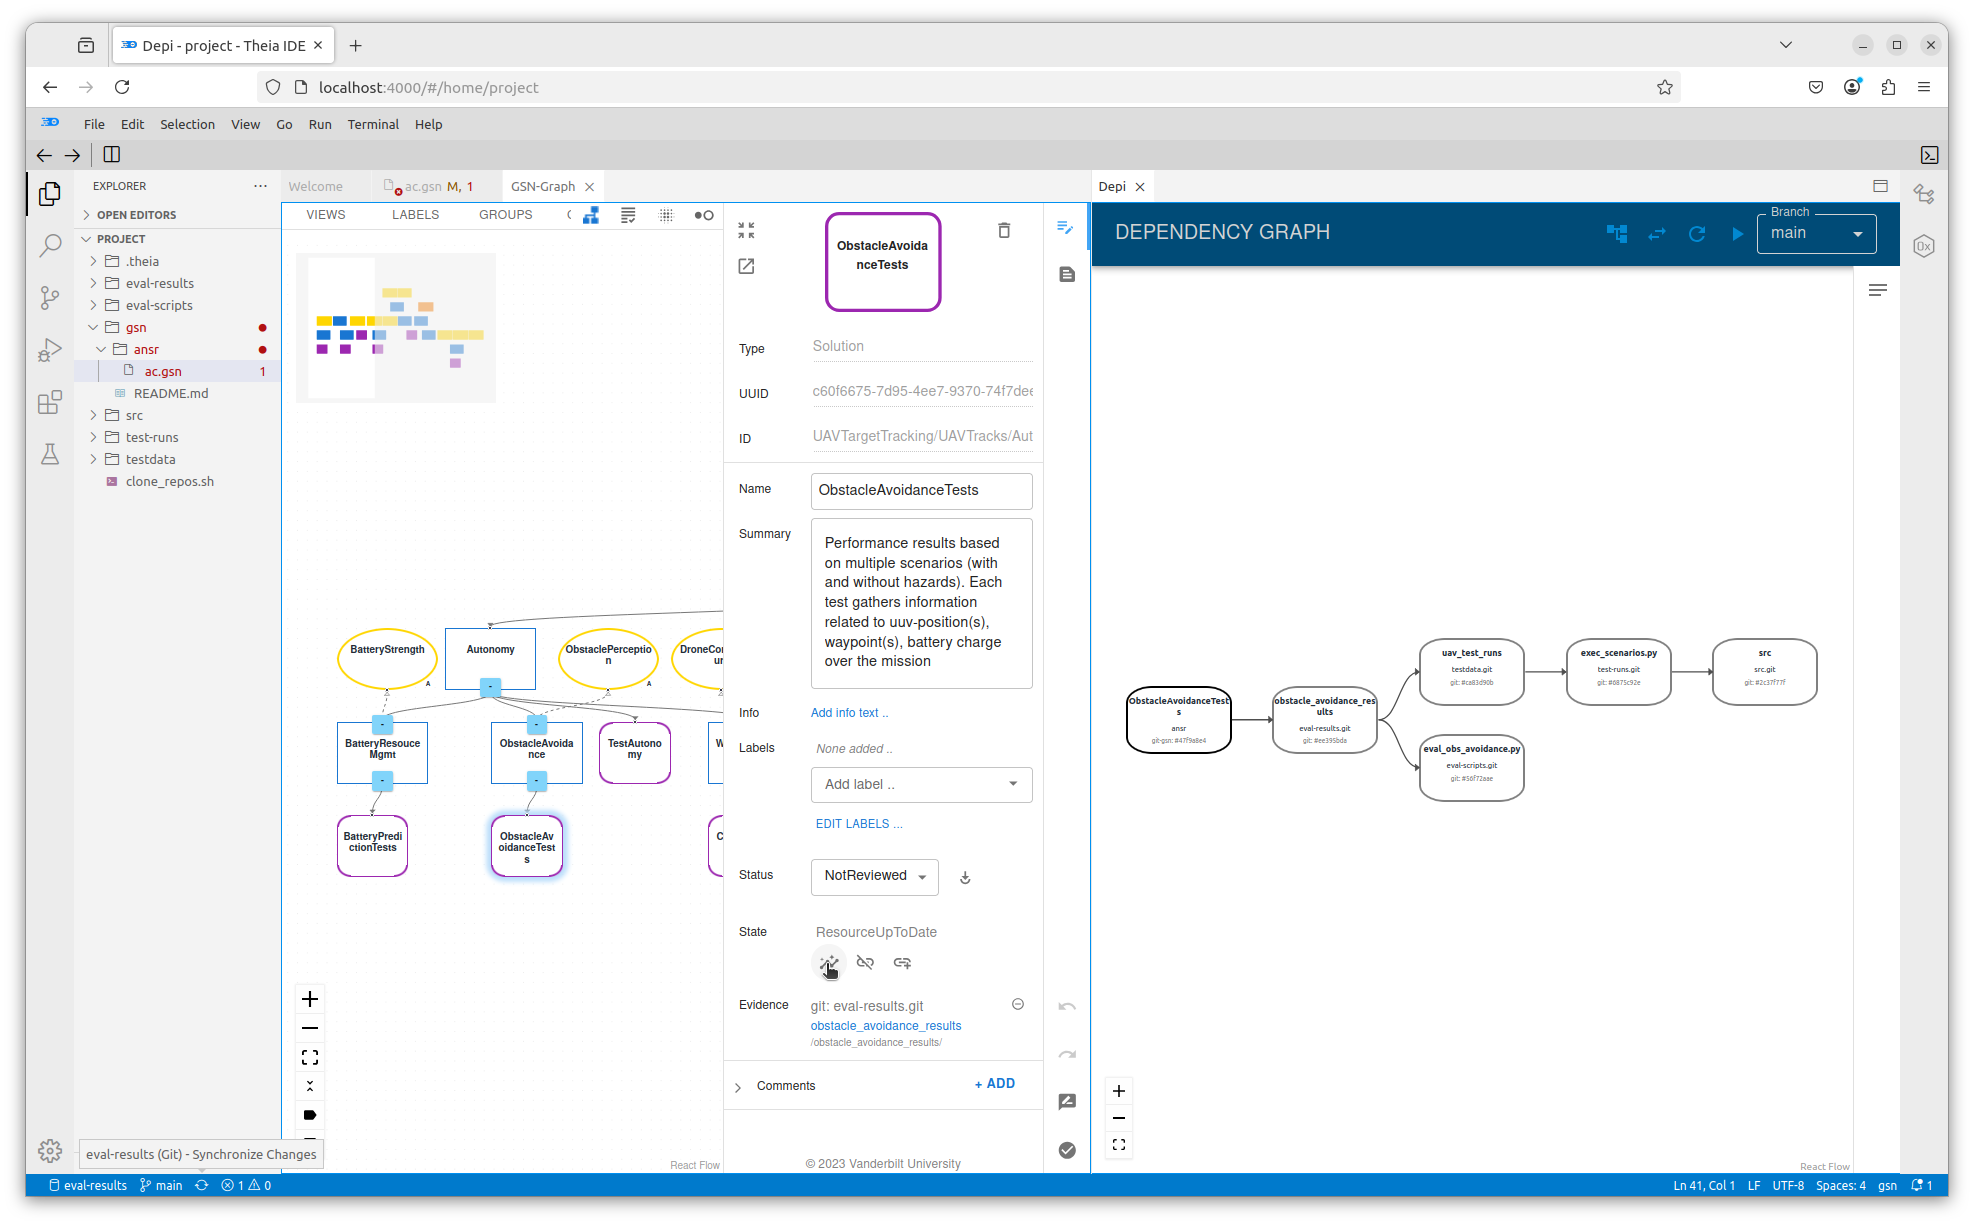
In this graph, we see that the ObstacleAvoidanceTest solution node at the left, which is in the gsn.git repository,
depends on other resources in our project that are contained in other git repositories. This is indicated by the arrowed lines:
| Dependency | Type | Location |
|---|---|---|
| obstable_avoidance_results | Direct | eval-results.git |
| eval_obs_avoidance.py | Inferred | eval-scripts.git |
| uav_test_runs | Inferred | testdata.git |
| exec_scenarios.py | Inferred | test-runs.git |
| src | Inferred | src.git |
Click the eval_obs_avoidance.py dependency, and it will turn blue to show that it is selected. Note that this is an inferred (indirect) dependency of the ObstacleAvoidanceTest solution node.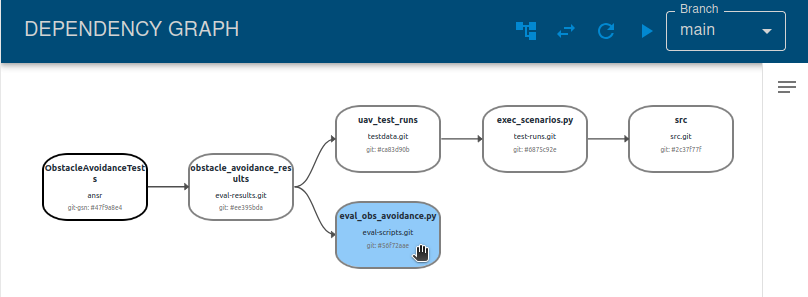
Then, click on the Dependency Info button![]()
at the upper right of the dependency graph: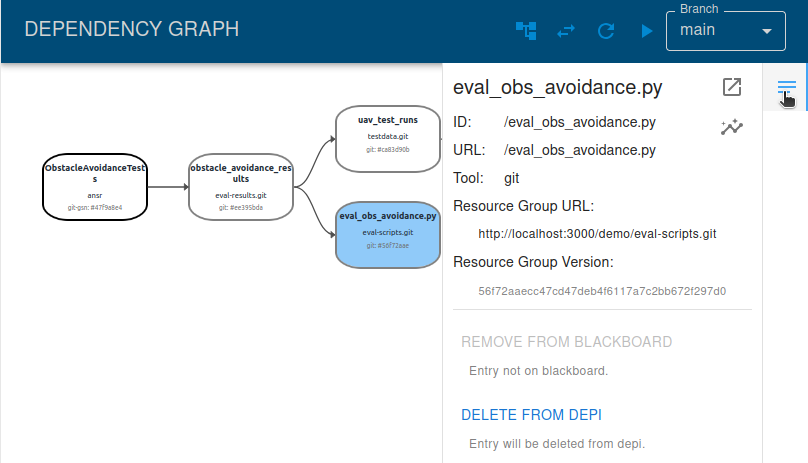
The resulting sub-pane shows information about the eval_obs_avoidance.py dependency. In this sub-pane, click the Reveal resource button![]()
at the upper right: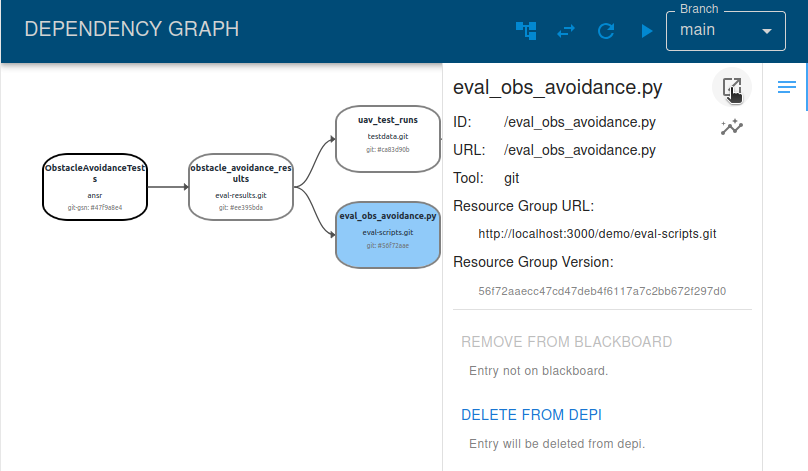
This will display the contents of the eval_obs_avoidance.py file in the right sub-pane of the Editor pane. It also highlights the eval_obs_avoidance.py file as part of the eval-scripts git repository in the Project pane at the left of the window.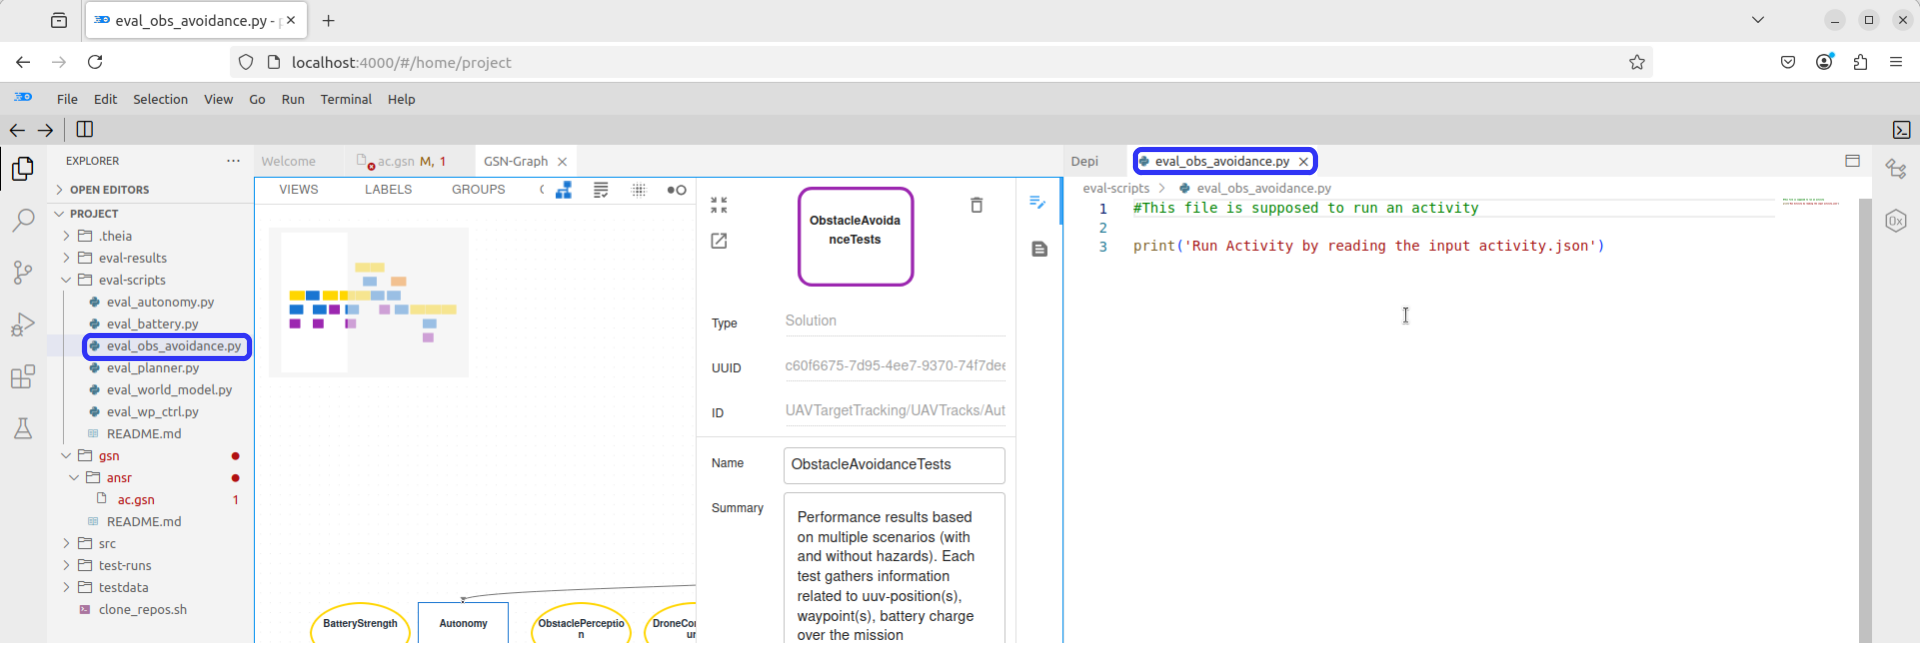
The other dependencies of the ObstacleAvoidanceTests solution node of the GSN model as shown in the dependency graph can be viewed using this same procedure.
Updating a Resource when its Dependencies Change
All resources in a project managed by CAID reside in source control repositories. In particular, all resources besides WebGME models reside in git repositories. WebGME also provides revision control, though not by using git. When a change is made to a resource in CAID, it must be committed and pushed to the main branch of its git repository for CAID to detect it (or, in the case of WebGME, committed to the master branch). Once this is done, CAID will flag for review all resources for which the resource is a dependency. This is to remind a developer to check these resources and make necessary changes to keep them in synchrony with the dependency.
Modifying the eval_obs_avoidance.py Dependency
We will now make changes to a dependency of the ObstacleAvoidanceTests solution node in the GSN graph, and use CAID to find the resources that need to be updated as a result. Continuing from the last section, in the right sub-pane of the Editor pane, make sure the eval_obs_avoidance.pytab is selected. Suppose eval_obs_avoidance.py is modified to include enhancements and bug fixes. We will not actually make such modifications here, but will instead add a comment to represent such changes: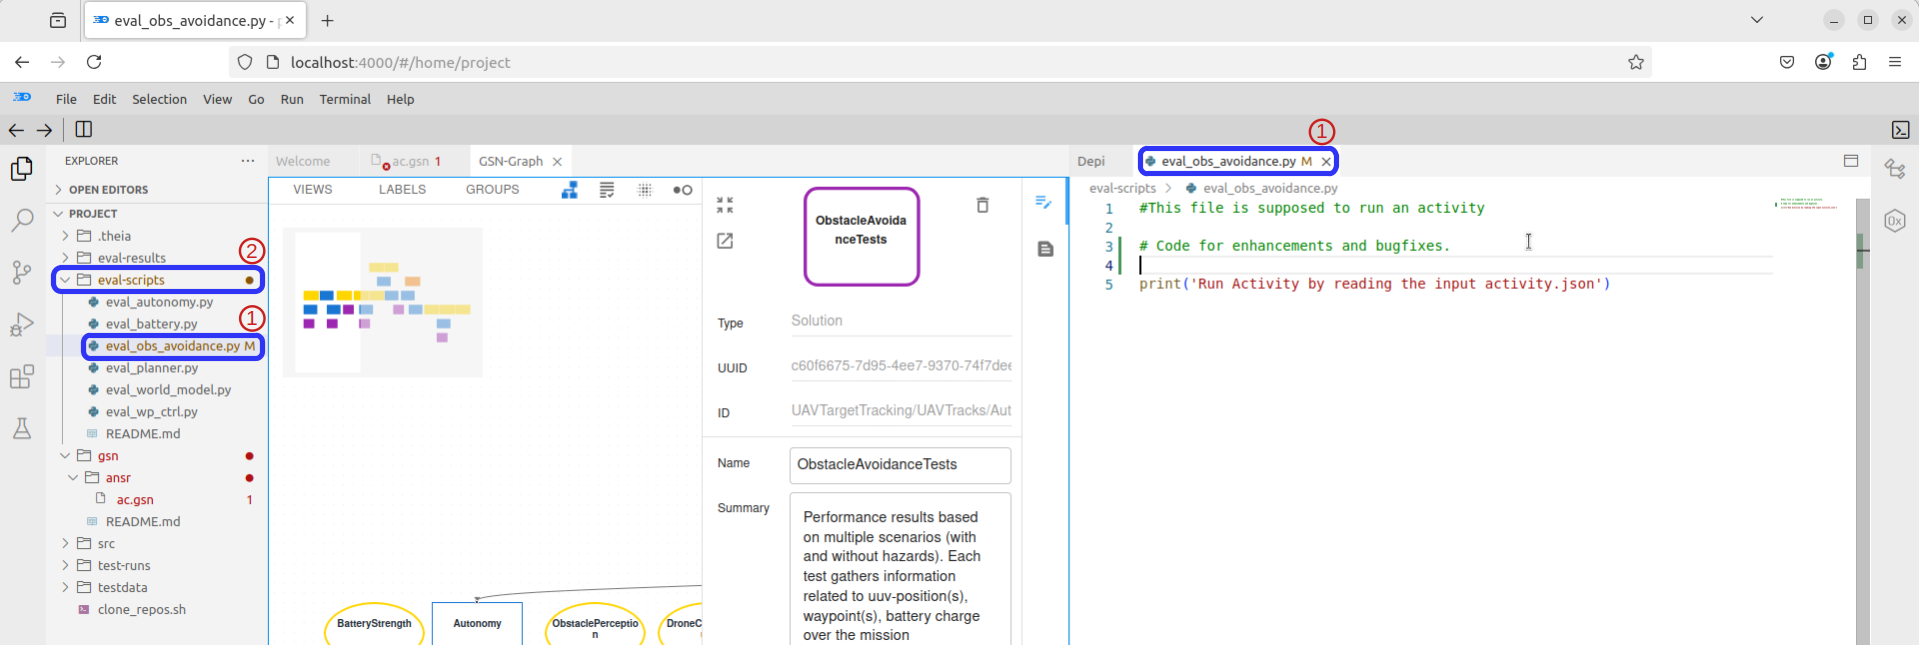
Note that, once you've made this modification:
- The
eval_obs_avoidance.pytab on the right side of theEditorpane, as well as theeval_obs_avoidance.pyfile item in theExplorerpane on the left side of the browser window, will both have anMon their right side. This is to indicate that theeval_obs_avoidance.pyfile has been modified. - The
eval-scriptsfolder item in theExplorerpane has a red dot on its right side. This is to indicate that
one or more files in this folder have been modified. - The
Source Controlbutton
near the upper left corner of the browser has a blue dot with a1in it at its lower right corner. This is to indicate that1file has been modified in theeval-scripts.gitrepository, of which theeval-scriptsfolder is the root folder.
Committing the Modification
We must now commit our modification of the eval_obs_avoidance.py file to the eval-scripts git repository.
In order to work this eval-scripts repository, we must select it by clicking on the repository selection button ![]() . at the lower left corner of the browser window.
. at the lower left corner of the browser window.
NOTE: There will be text on this button that indicates the currently selected
gitrepository.
Pressing this button will is cause a repository selection sub-window to appear in the top middle of the browser window:

In this sub-window, select the eval-scripts git repository by typing its name in the text-box, or by clicking on its name:

Now that the eval-scripts git repository is selected, note that:

-
The text on the repository selection button
 is now
 eval-scripts. -
The
Source Controlbutton near the upper left corner of the browser has a blue dot with a 1in it at its lower right corner. This is to indicate that1file has been modified in theeval-scripts.gitrepository, of which theeval-scriptsfolder is the root folder.Click on the
Source Control button. This will cause the SOURCE CONTROL: GITpane to appear on the left side of the browser window: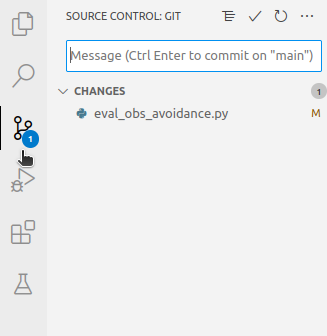
By hovering over theCHANGESline in this pane, theStage All Changesbutton
will appear. Click on this button to stage the modification to theeval_obs_avoidance.pyfile: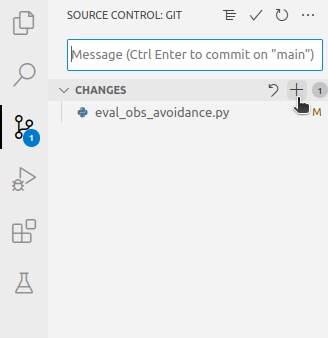
Enter a commit message in theMessagetextbox, and then click on theCommitbutton :
: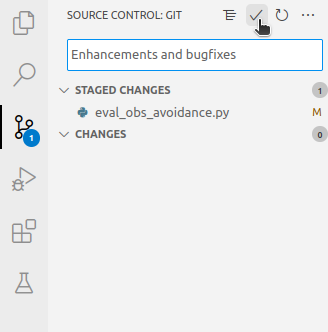
A thin blue line will appear above theMessagetextbox for a few seconds. Once it is no longer visible, the commit is complete.
Now, click on theMore Actions ...button
located to the right of theCommitbutton, and in the resulting drop-down menu, select 'Push':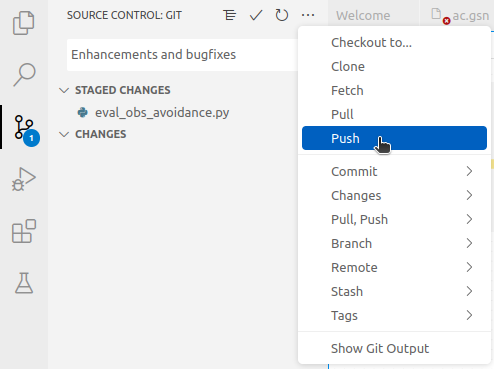
In the resulting sub-window, select theeval-scriptsrepository: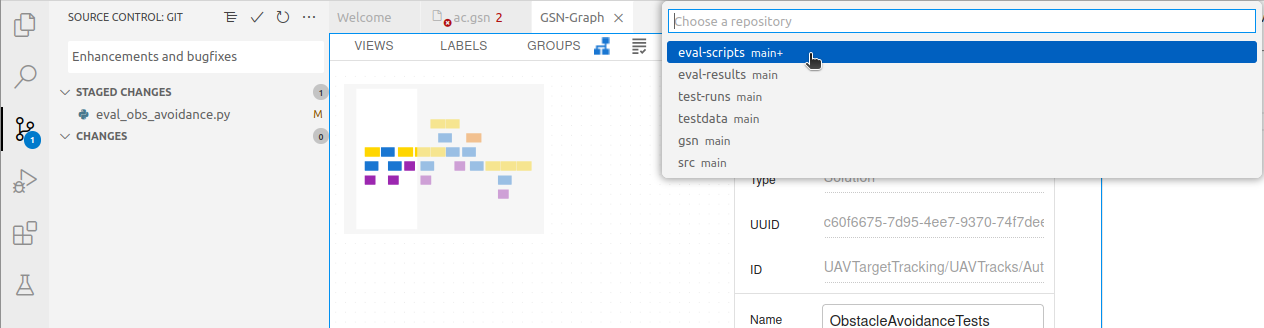
Again, a thin blue line will appear above theMessagetextbox for a few seconds. Once it is no longer visible, the
push is complete.
NOTE: A small sub-window may appear at the lower right corner of the browser that reads:
Would you like the Theia IDE to periodically run "git fetch"?Just click "No" in this sub-window
Bringing the Resources into Synchrony
Now, click on the Depi tab in the right sub-pane of the Editor pane: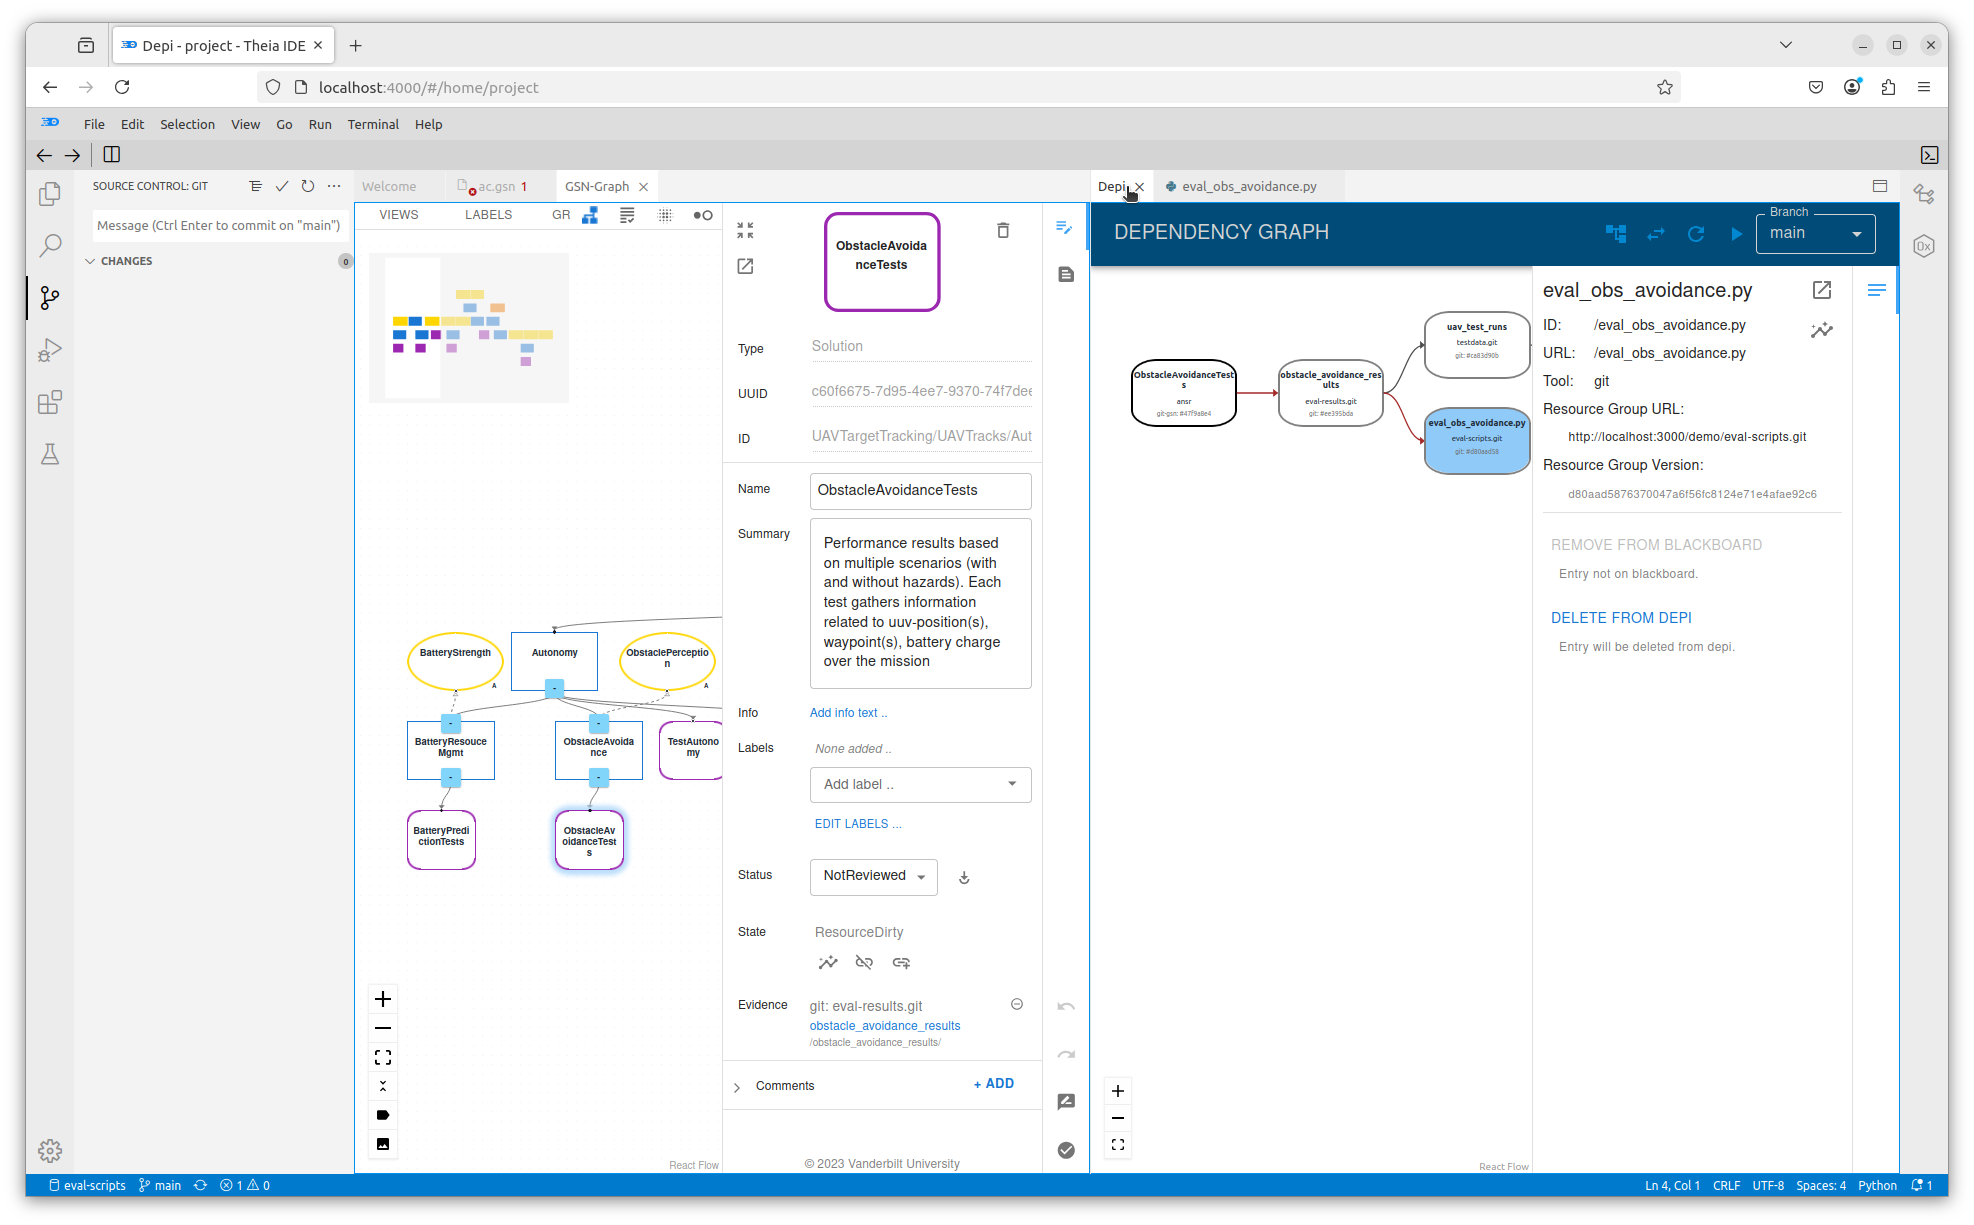
The dependency graph for the ObstacleAvoidanceTests solution node is again displayed.
NOTE: To see the whole graph, you can click on the
Dependency Infobutton
at the upper right of the graph to hide the information pane at the right.
If you do this, be sure to click it again to display the information pane. We will need this for what follows.
Notice that two of the dependency links (arrowed lines), in particular those upstream from eval_obs_avoidance.py, are now colored red. This indicates that these dependencies are Dirty, and the nodes incident on them, obstacle_avoidance_results and ObstacleAvoidanceTests (the solution node in the GSN graph), should be reviewed and perhaps modified to bring them in synchrony with the modified eval_obs_avoidance.py file. If you click on the dependency link between the obstacle_avoidance_results and eval_obs_avoidance.py nodes, it will turn light-blue, and information about the dependency will appear in the information sub-pane to the right: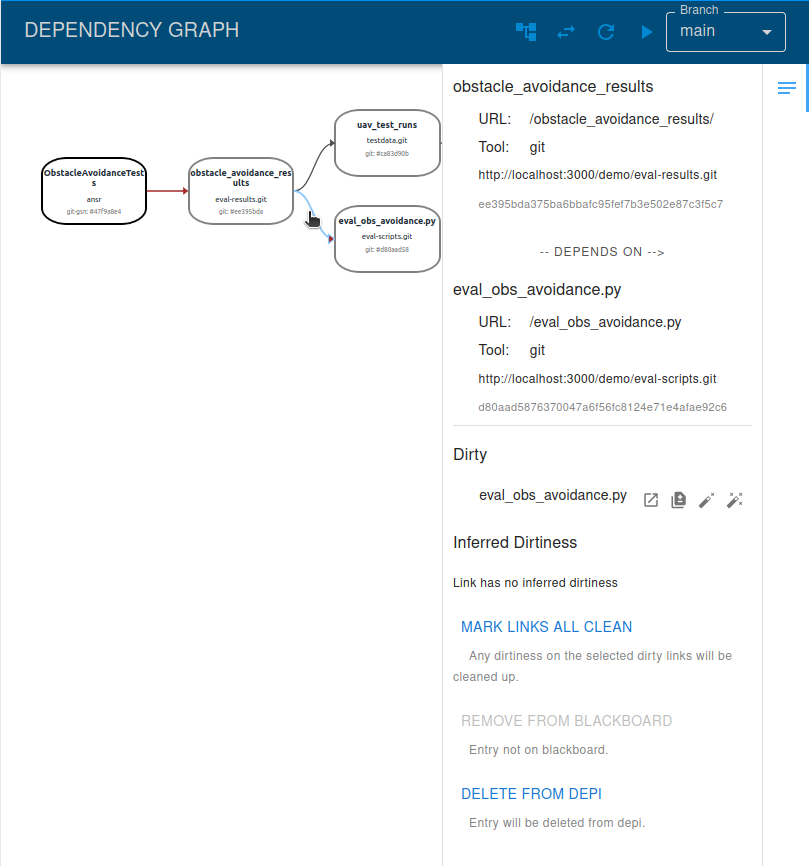
This information shows that there is a direct dependency between obstacle_avoidance_results andeval_obs_avoidance.py, and that it is Dirty. If we click on the link between ObstacleAvoidanceTests and obstacle_avoidance_results, we see this link is also Dirty due to the modified eval_obs_avoidance.py file, but that the dirtiness is indirect, or inferred, through obstacle_avoidance_results.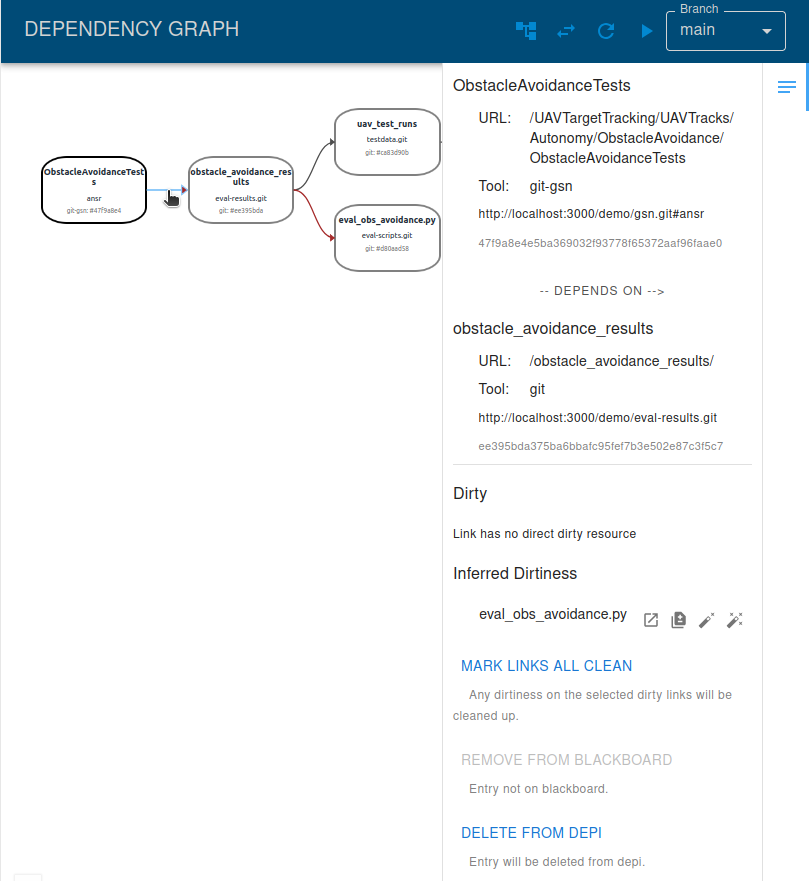
Let us first bring obstacle_avoidance_results in synchrony with the eval_obs_avoidance.py modifications.
As we did with the eval_obs_avoidance.py node:
- Click on the
obstacle_avoidance_resultsnode - In the information sub-pane on the right, click on the
Reveal resourcebutton :
:
Because obstacle_avoidance_results is a folder, the Reveal resource button only reveals its contents in the Explorer pane on the left side of the browser window. To see the contents of the file metric.csv in the Editor pane, you will need to click on it in the Explorer: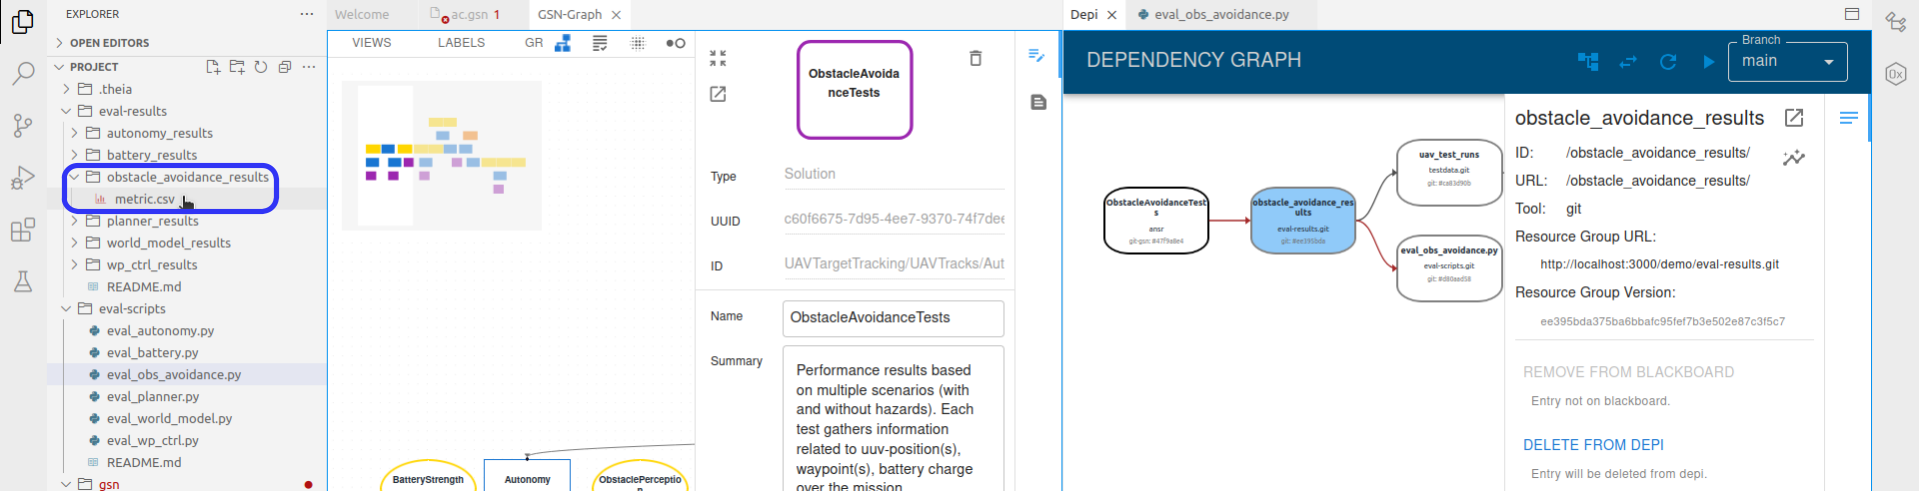
To bring the data in obstacle_avoidance_results into synchrony with the eval_obs_avoidance.py, we will edit the metric.csv file. For this tutorial, let's say this is done by changing the metric2 value to 75: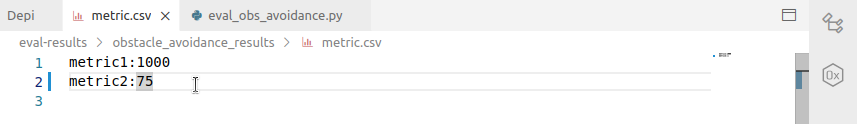
We will also commit and push this modification to the main branch of the eval-results repository in the same way as with eval_obs_avoidance.py of the eval-scripts repository (see above). To do this:
- Click the repository selection button

in the lower left corner of the browser window. - Select the
eval-resultsrepository in the resulting sub-window. - Click the source control button,
which should have a blue circle with a1in it at its lower right corner. - Click the
Stage all Changes
button in theCHANGESline of theSOURCE CONTROL: GITpane. - Enter an appropriate commit message in the
Messagetextbox. - Click on the
Commitbutton. - Once the thin blue line above the
Messagetextbox is no longer visible, click theMore Actionsbutton. - Select 'Push' from the resulting drop-down menu.
- Select
eval-resultsin the resulting sub-window.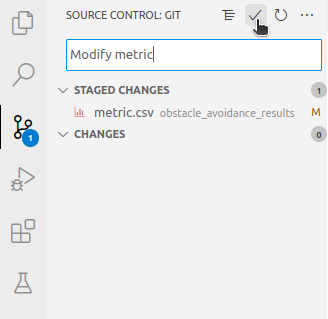
Once the push is complete, again click on theDepitab in the right sub-pane of theEditorpane, and click on the dependency link betweenobstacle_avoidance_resultsandeval_obs_avoidance.py. Now that theobstacle_avoidance_resultshas been modified to be in synchrony witheval_obs_avoidance.py, we can mark this dependency ascleanby clicking theMark as cleanbutton :
: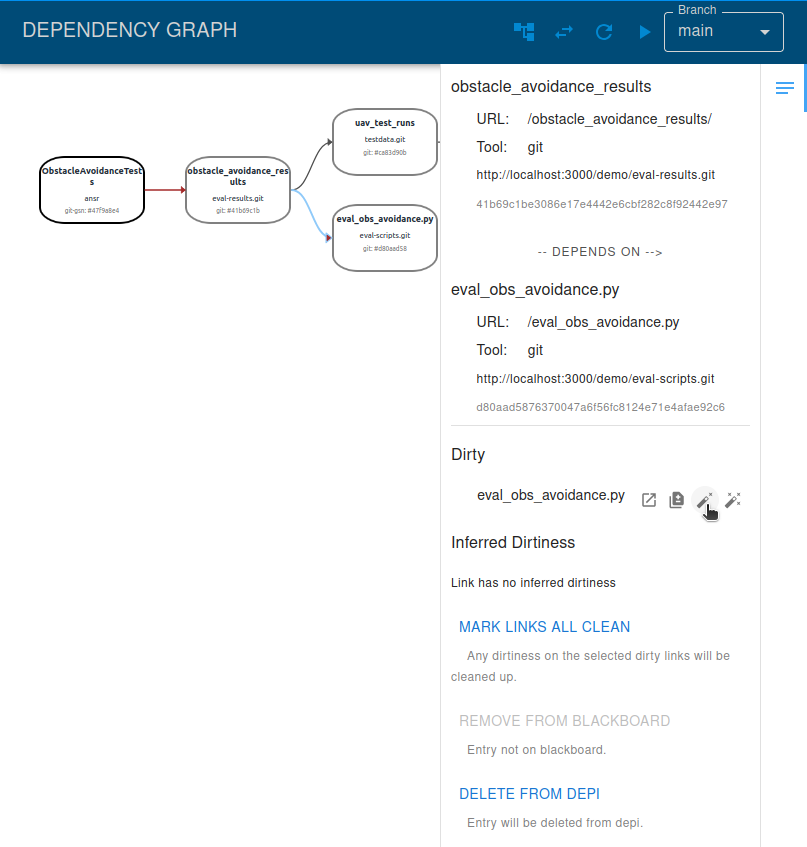
Note that dependency link betweenobstacle_avoidance_resultsandeval_obs_avoidance.pyis no longer dirty: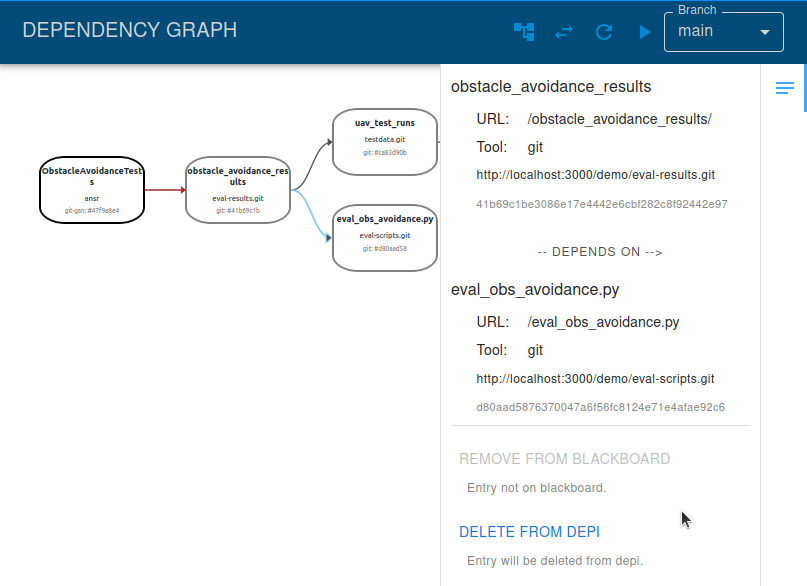
and if you click on the white background in theDependency Graphsub-pane, this link is no longer red:
Click on the dependency link betweenObstacleAvoidanceTestsandobstacle_avoidance_resultsagain, and note that it is now dirty in two ways:
- The inferred dirtiness from the modification to
eval_obs_avoidance.py - The direct dirtiness from the modification to
obstacle_avoidance_results
When the appropriate modifications are made to the ObstacleAvoidanceTests solution node, we can click theMark as clean button![]()
for both of these forms of dirtiness to complete our dependency review: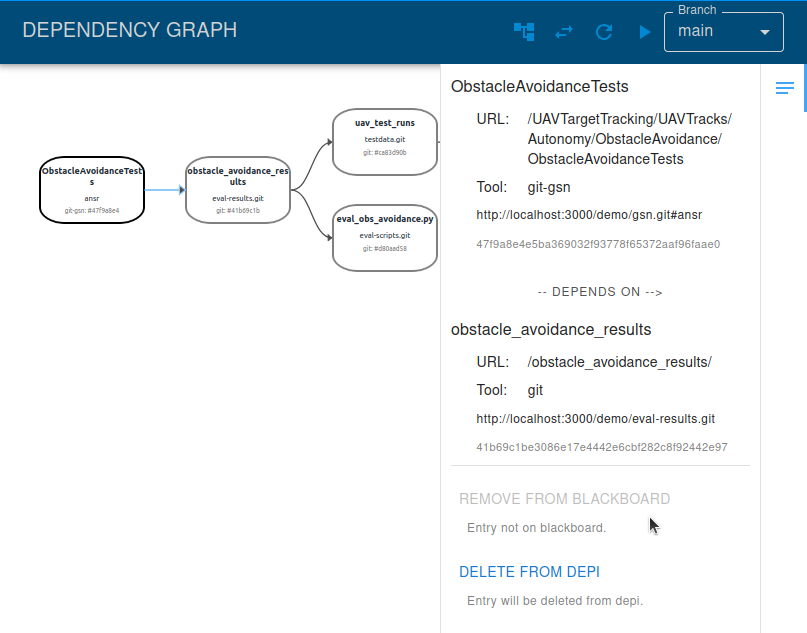
CAID and WebGME
WebGME can be used to model control systems graphically. The advantage of WebGME is that interpreters can be written, in JavaScript or Python, to traverse a WebGME model and generate program code (or artifacts) that implements the model. This code is then stored in one or more files. To learn more about WebGME, click this link.
WebGME is integrated into CAID so that it can be executed and used in the Editor pane, and, as well, the dependencies between WebGME model components and the code files it generates can be managed.
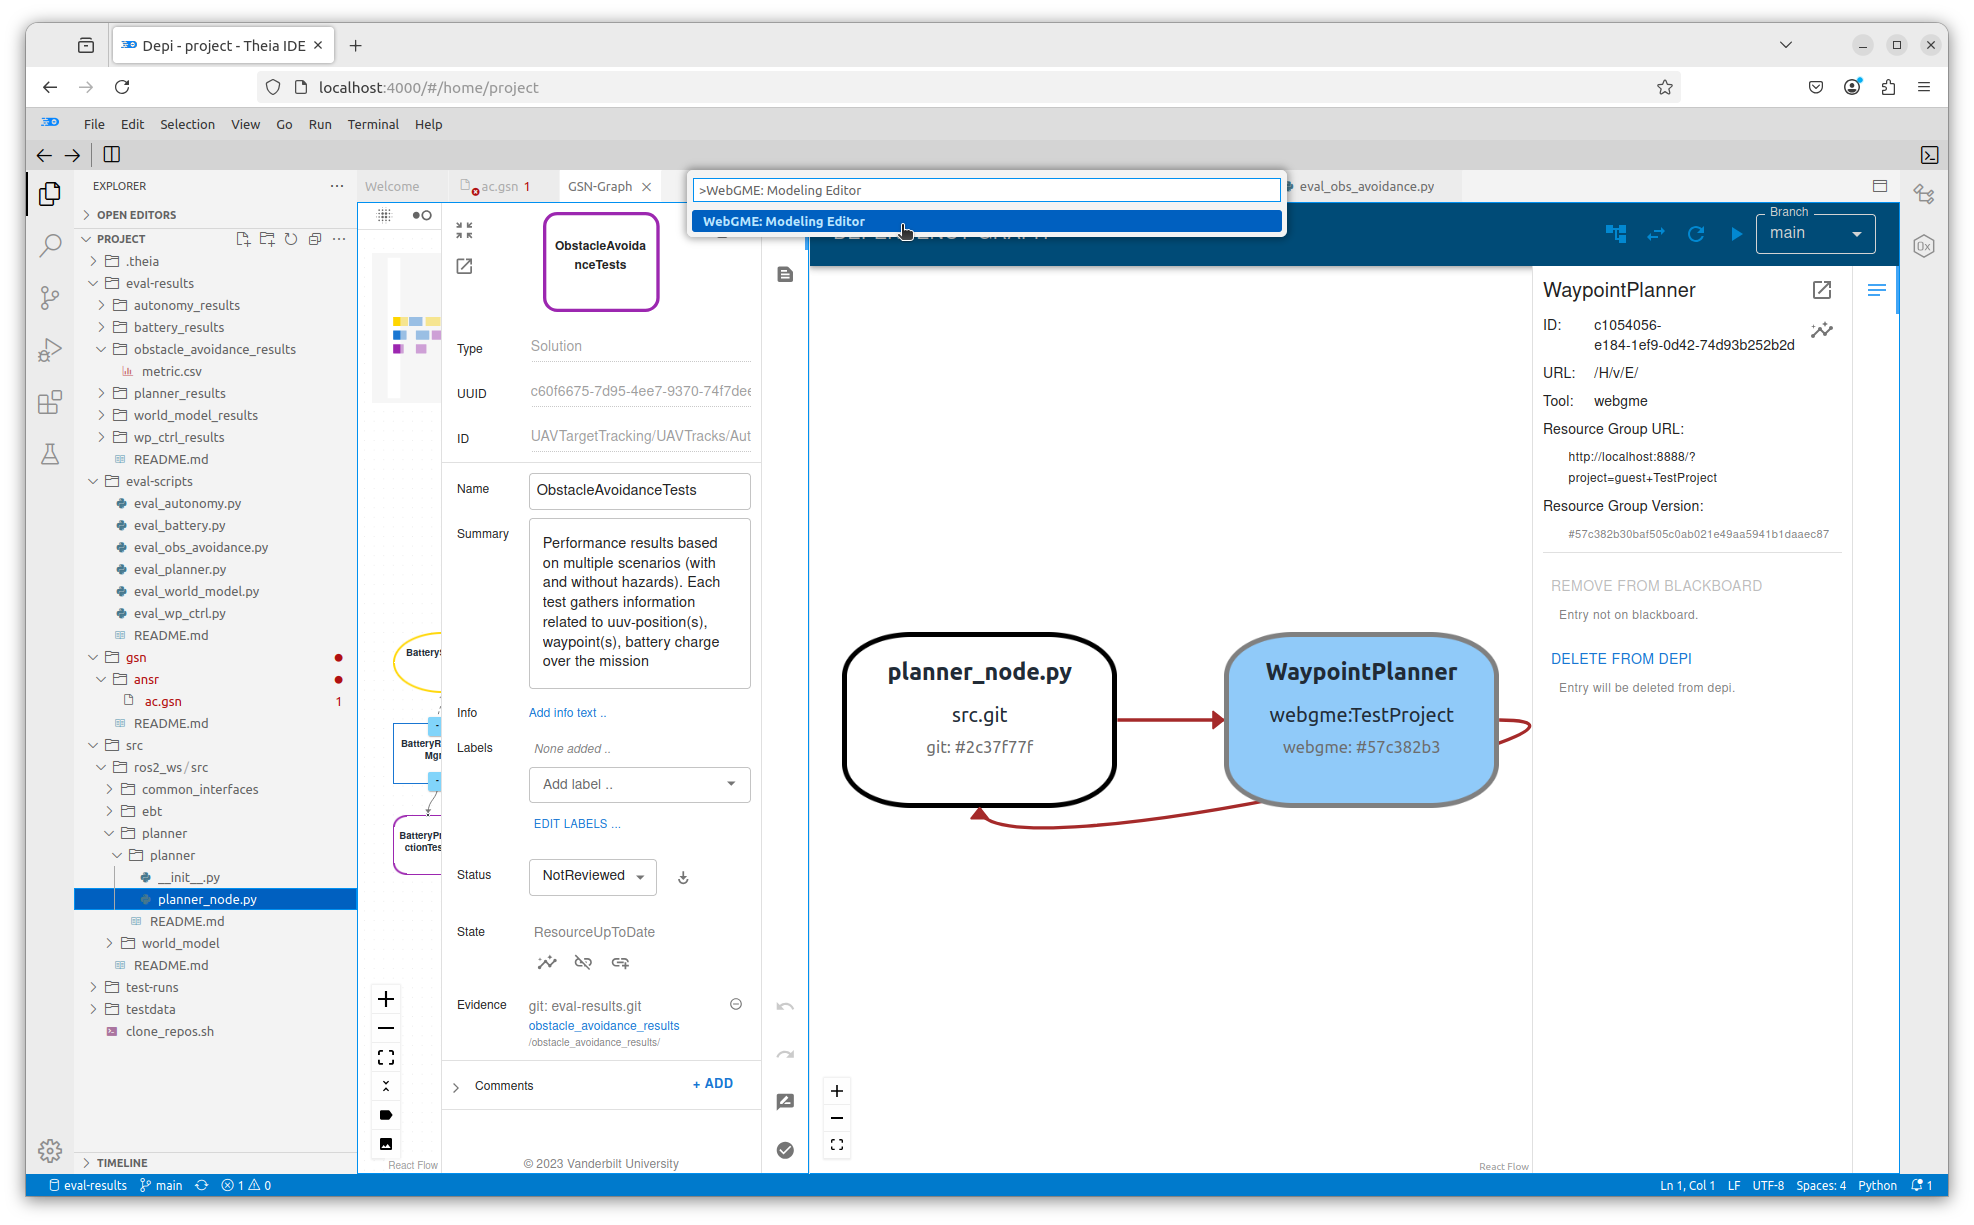
The following example shows one means of accessing WebGME using CAID. Open the Depi Blackboard as we did in The Depi Blackboard Section above, with all of the dependency links displayed, and notice that the dependencies between resources in the webgme:TestProject WebGME model and the src.git repository: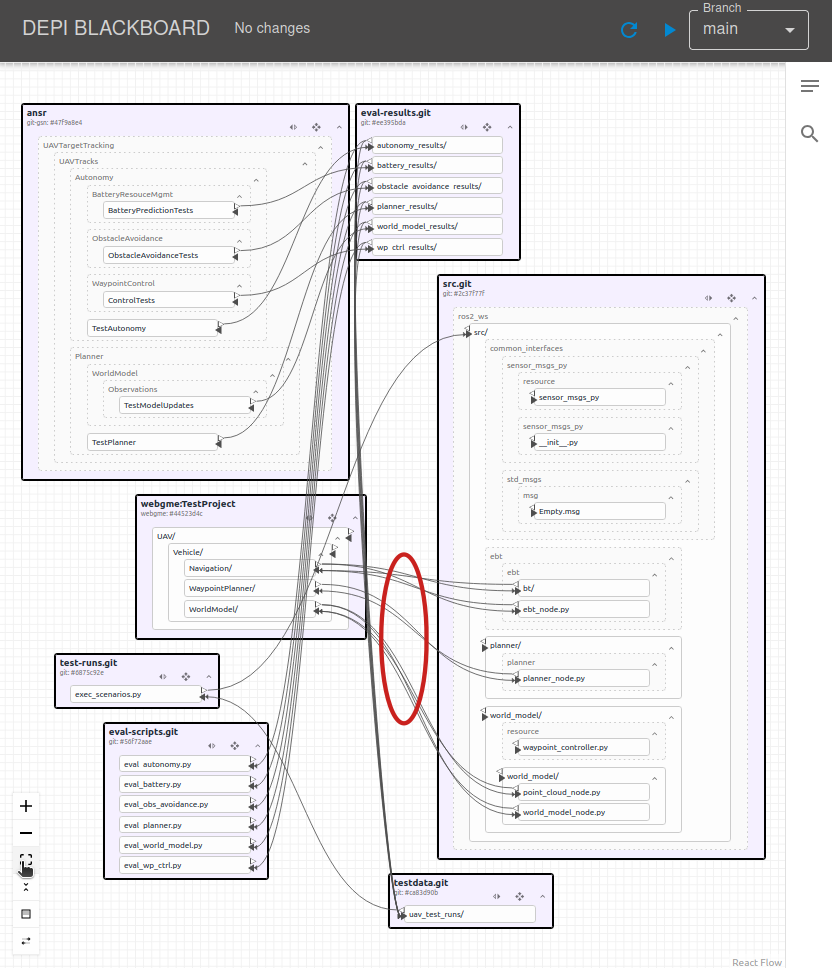
Note that these are circular dependencies, i.e. a resource in the src.git repository (e.g. the planner_node.py file) has a resource in the webgme:TestProject WebGME model (e.g. the WaypointPlanner component) as a dependency, and this same resource in the webgme:TestProject WebGME model has the same resource in src.git as a dependency. This is because the WebGME model, which is of a control system, is used to generate source code into src.git that implements this control system. If a WebGME model component changes, the file that contains the code it generates needs to be updated so that they remain in synchrony. As well, if a file is updated (independently, i.e. not due to a change in the WebGME model), the corresponding component in the WebGME model should be updated. We can view the dependency graph a particular component/file pair by expanding the src repository in the Explorer pane until we can see one of the source files. For this tutorial, we will use planner_node.py.
NOTE: Click on the Explorer Button
near the top left corner of the browser window to view theExplorerpane.
Click on this file using the secondary mouse button, and in the resulting pop-up menu, selectShow Dependency Graph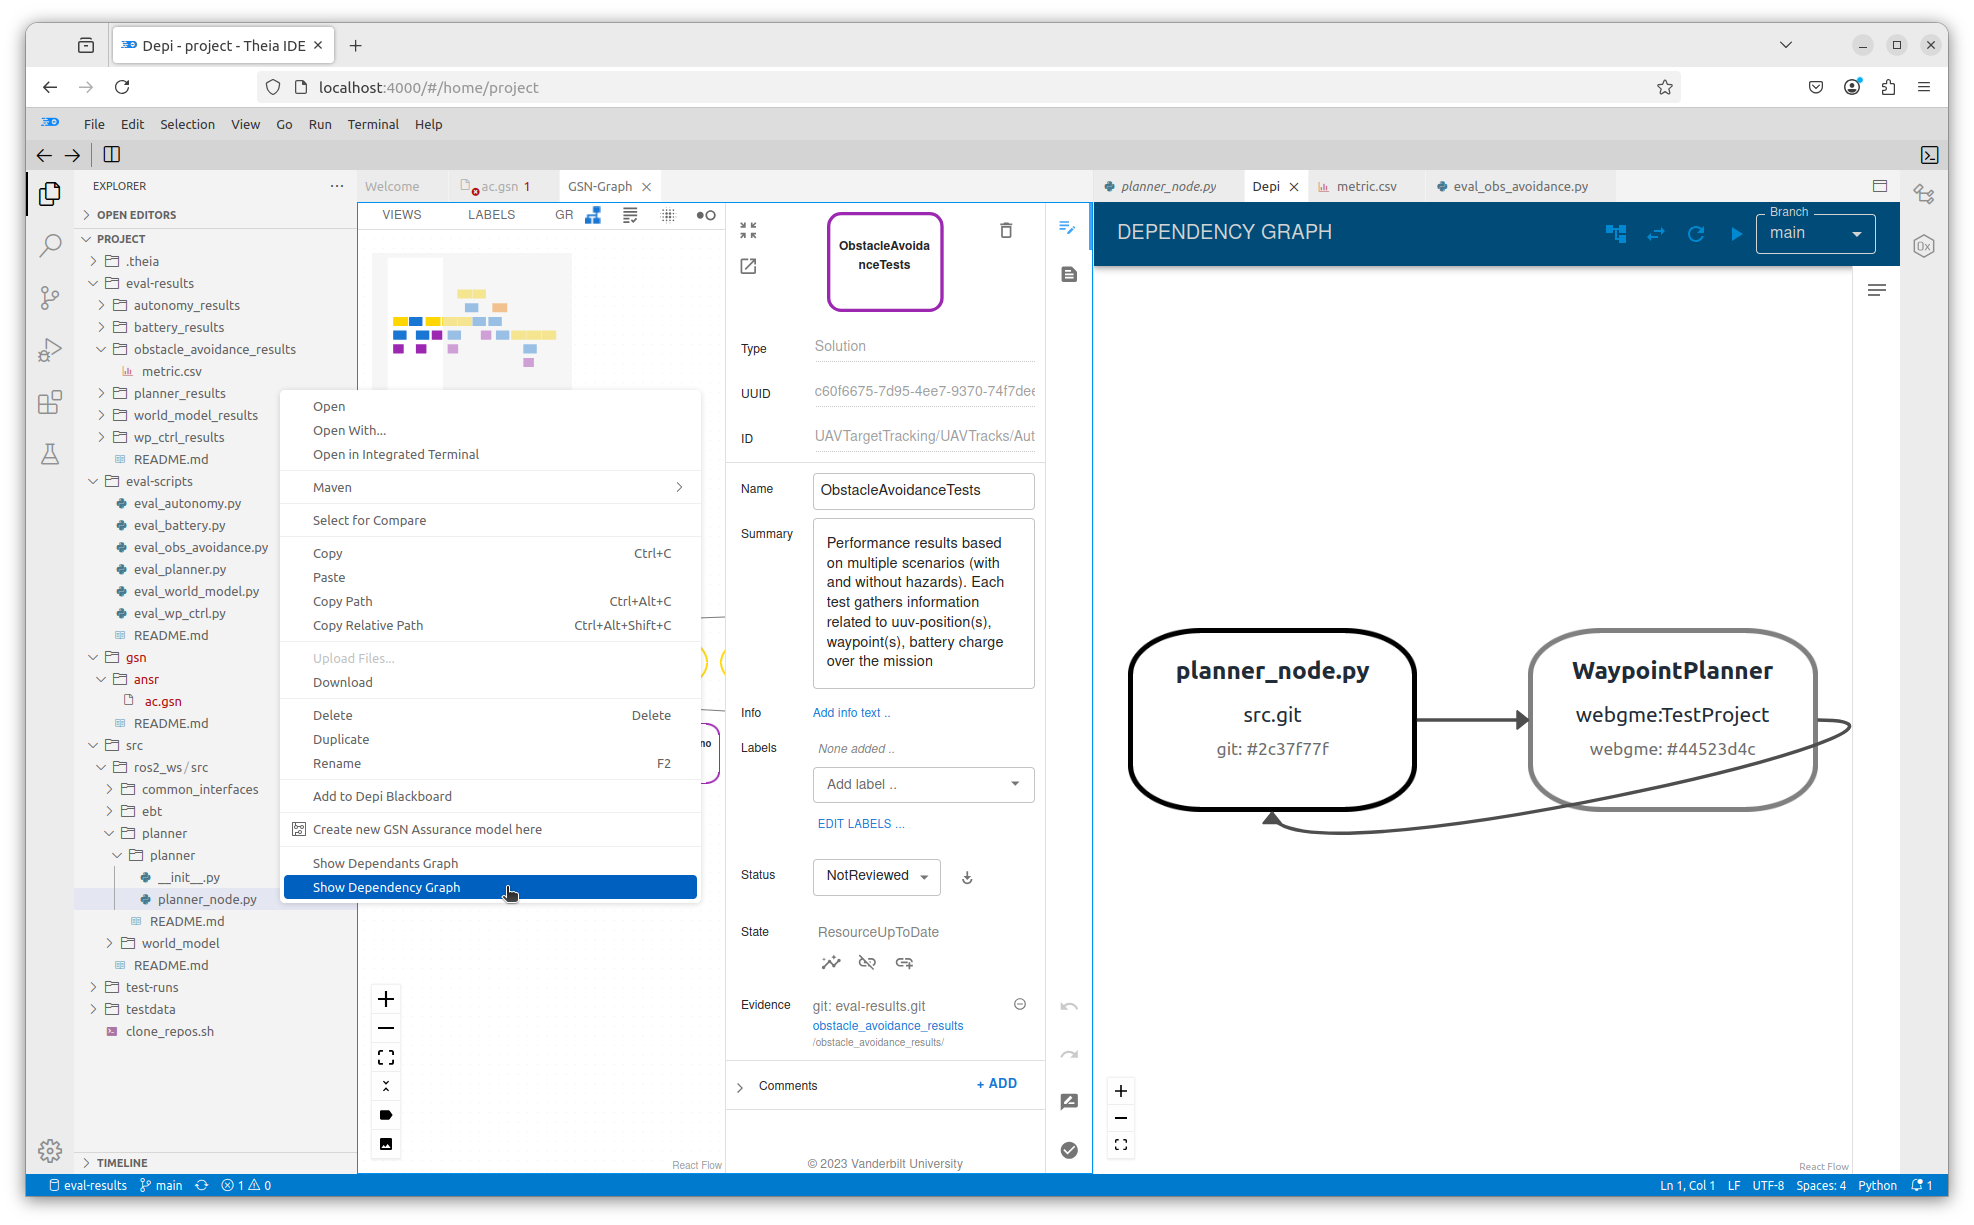
The dependency graph will appear in the right sub-pane of the Editor pane. To launch WebGME and view the WaypointPlanner component of the WebGME model:
- Click on the
WebpointPlannernode in the dependency graph (it will turn blue to indicate that it is selected) - Click on the
Dependency Infobutton
at the upper right of the dependency graph - In the
Dependency Infopane, click theReveal resourcebutton
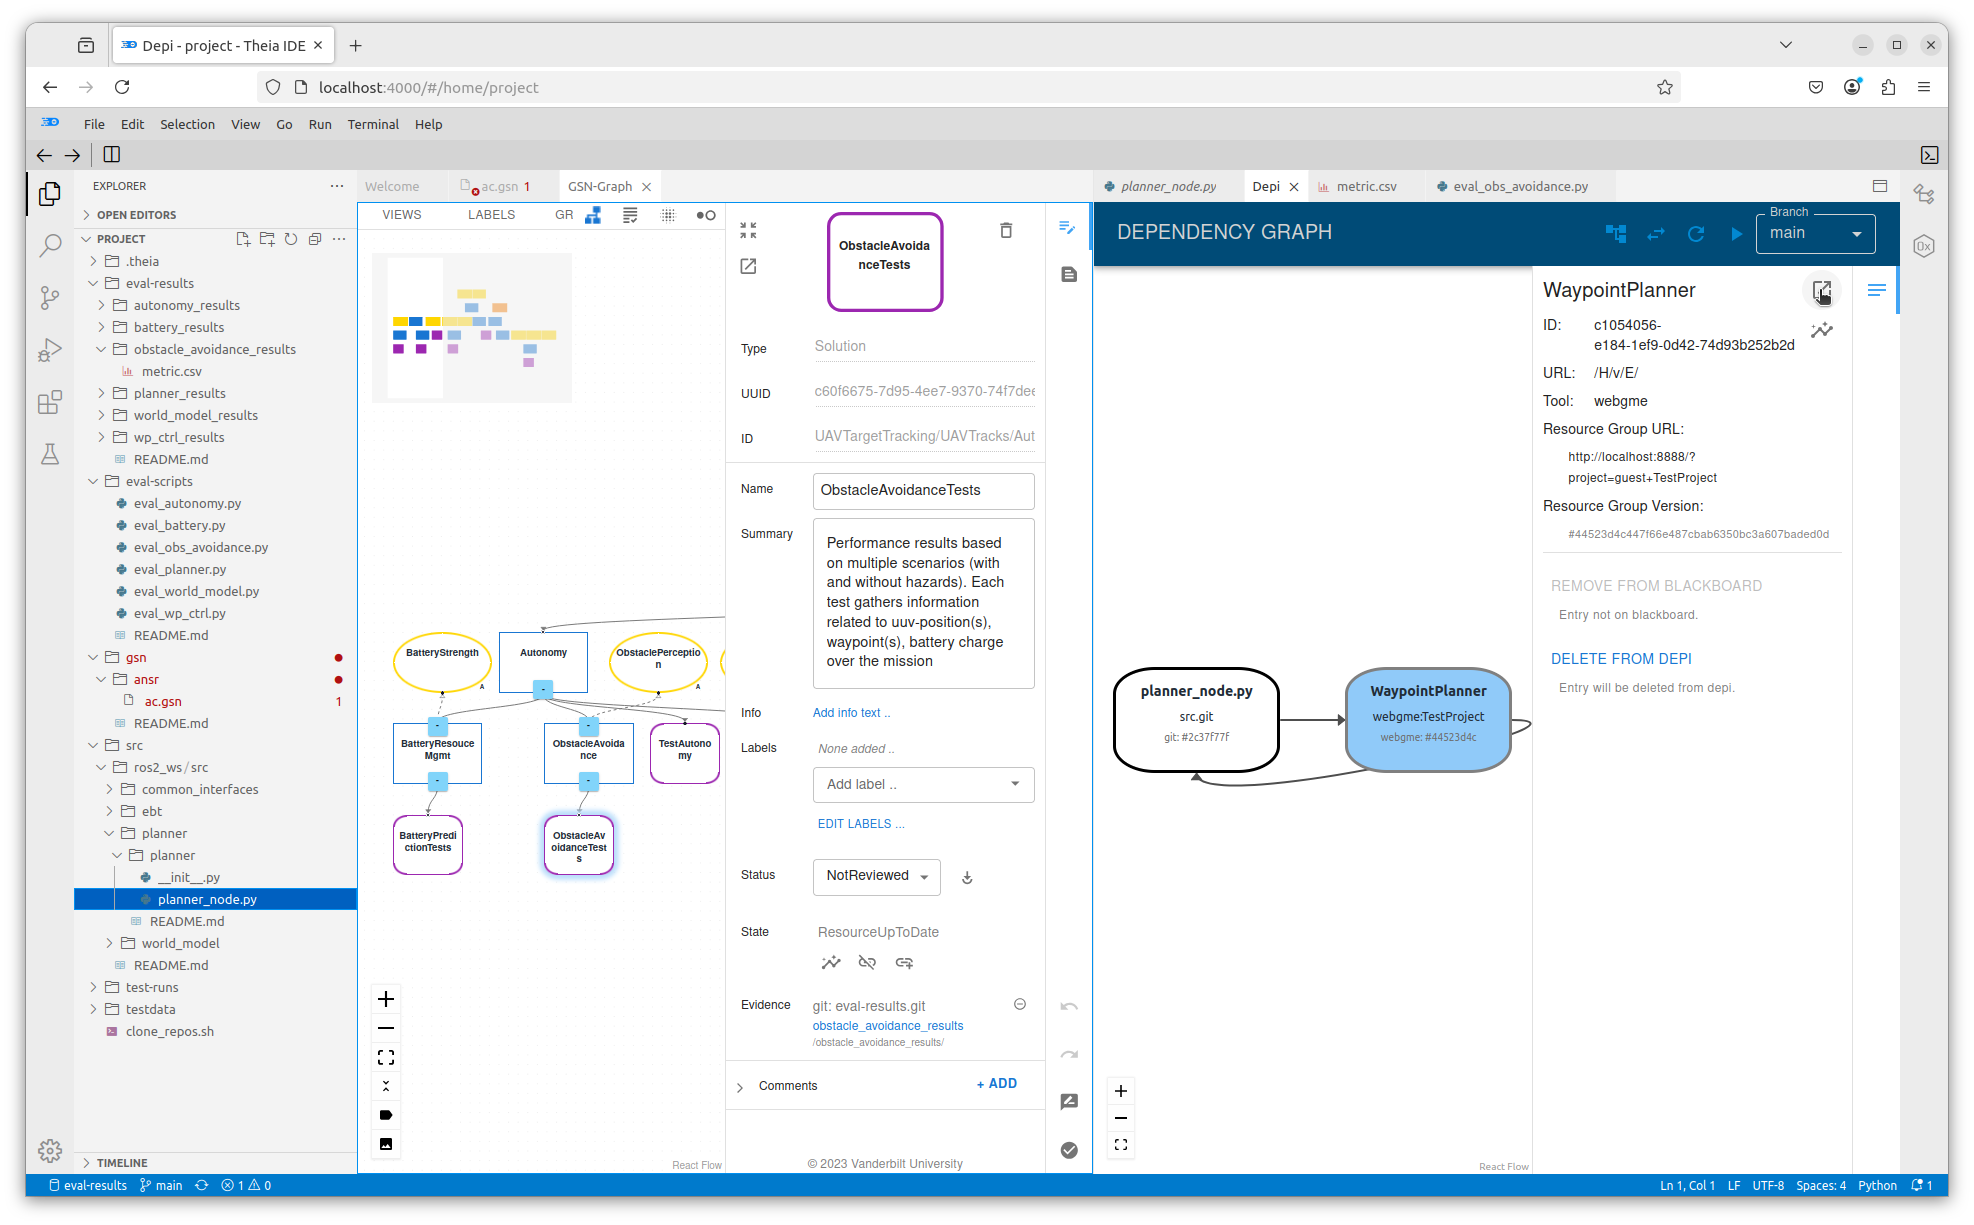
The WebGME Editor, with WaypointPlanner seleced, will appear in the right sub-pane of the Editor pane: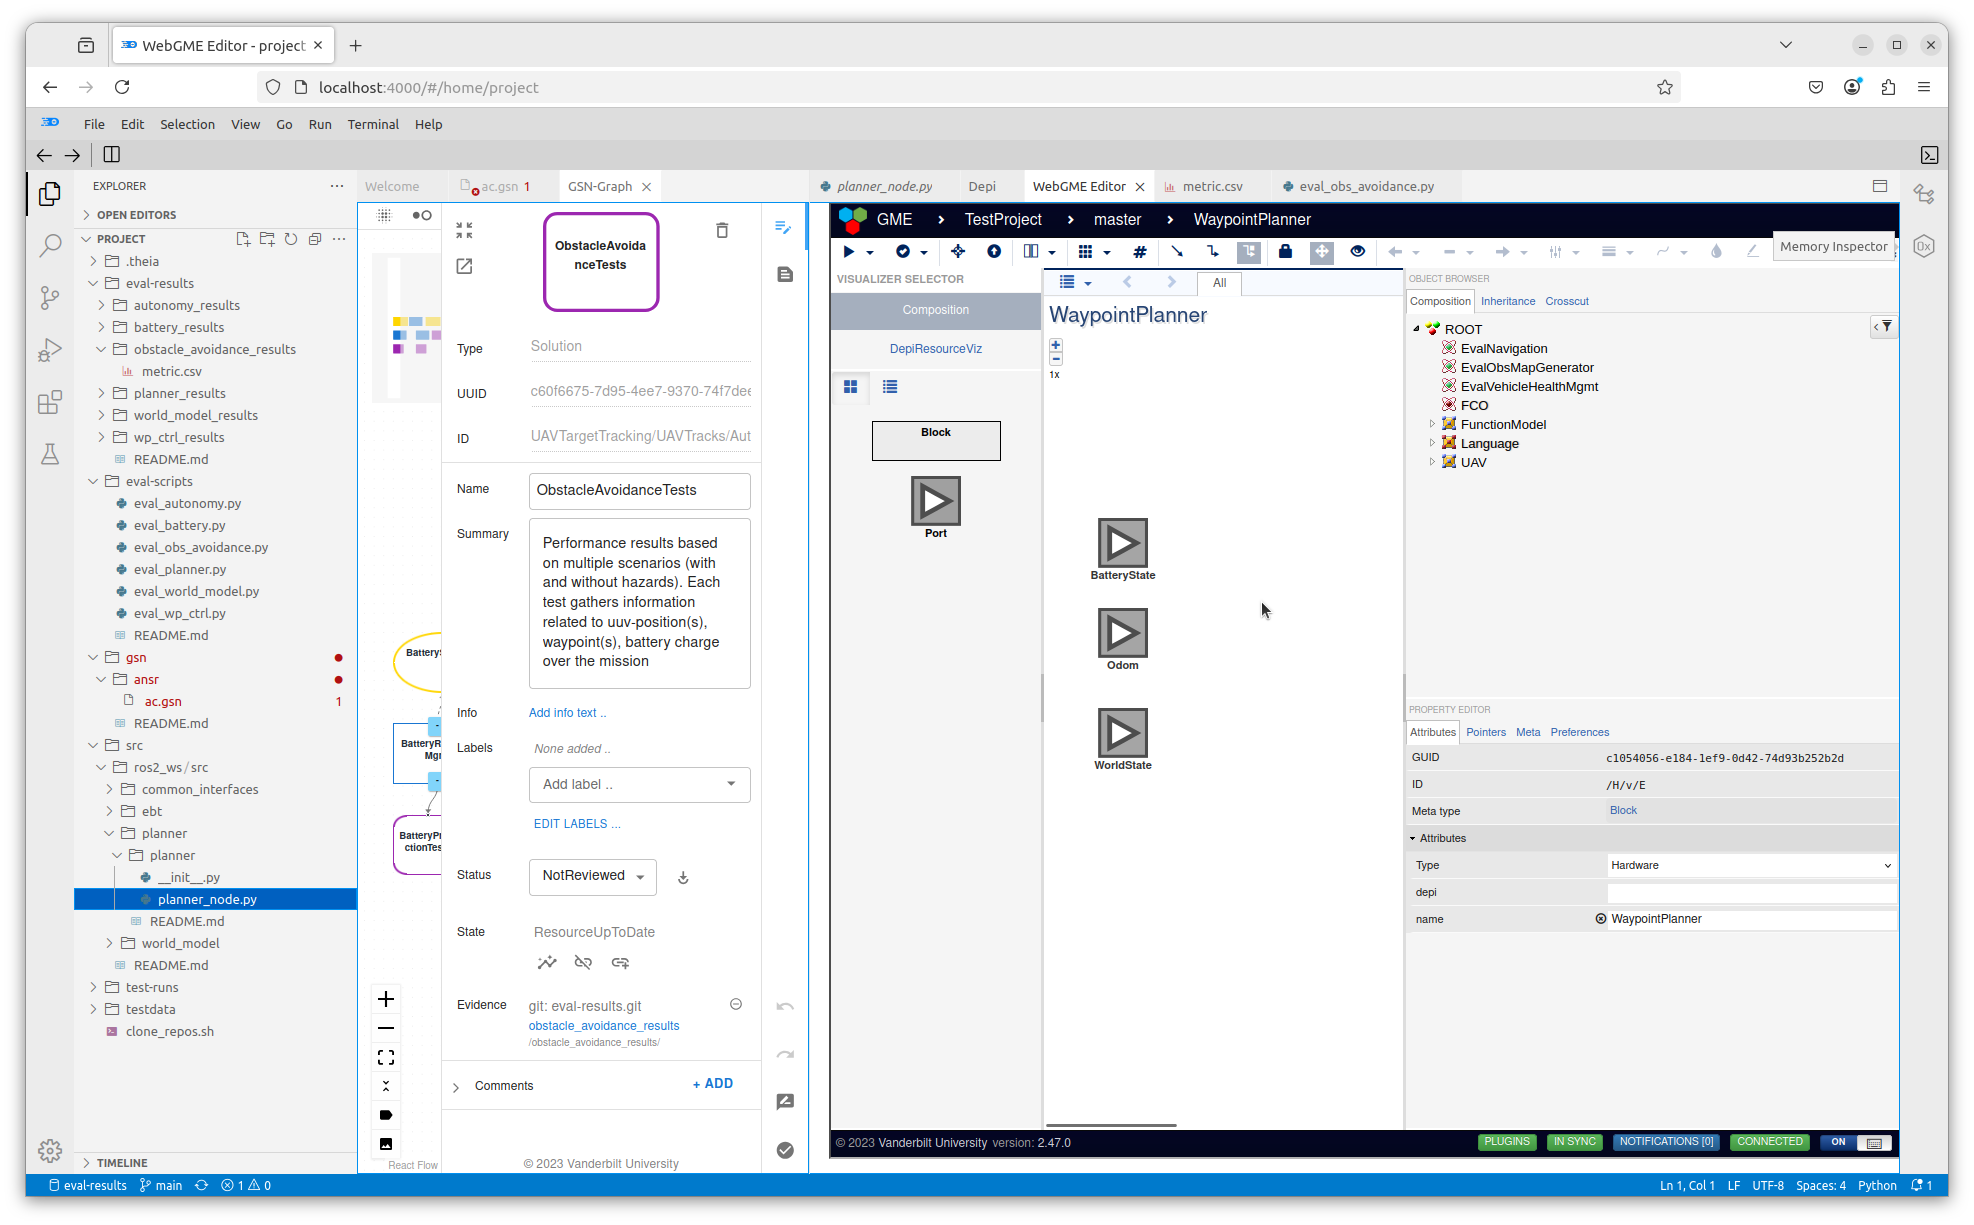
To modify the WaypointPlanner, click on the name of the WebGME model, TestProject for this example, at the top of the WebGME Editor. In the resulting drop-down menu, click on ProjectHistory:
In the pop-up window, click on master: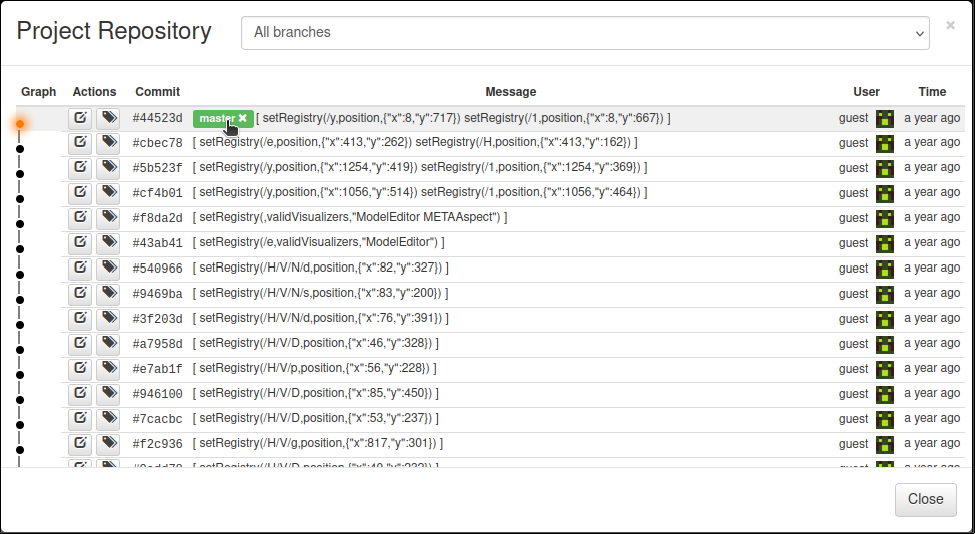
Then click the Close button in the lower right corner: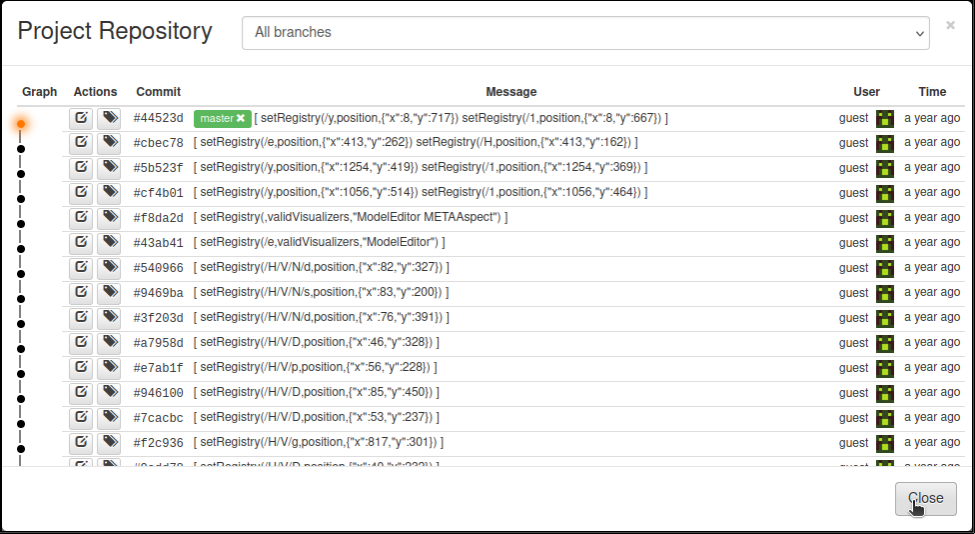
Now, modify the WaypointPlanner component of the WebGME model by clicking and dragging a Port
from the Part List on the left into the WaypointPlanner sub-pane: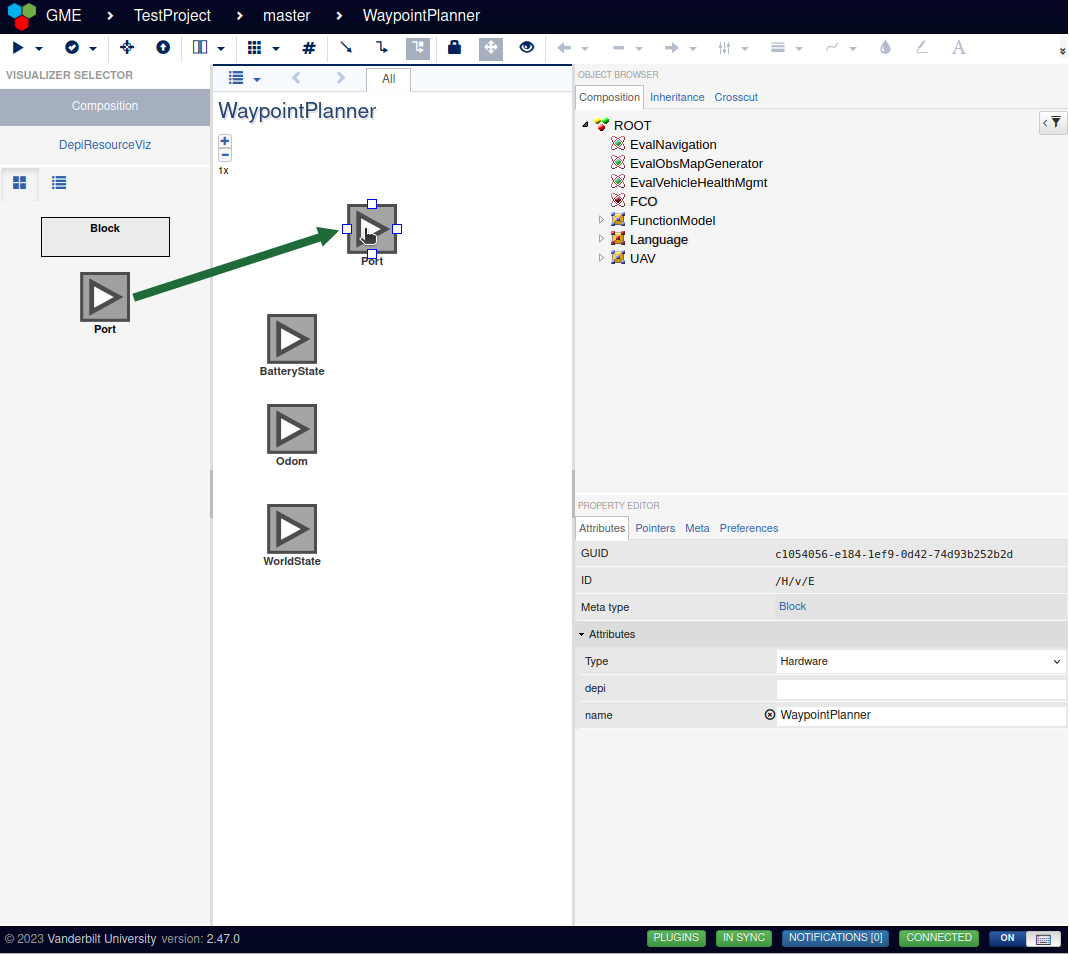
Now that the WaypointPlanner has been modified, click on the Depi tab on the right sub-pane of the Editor pane: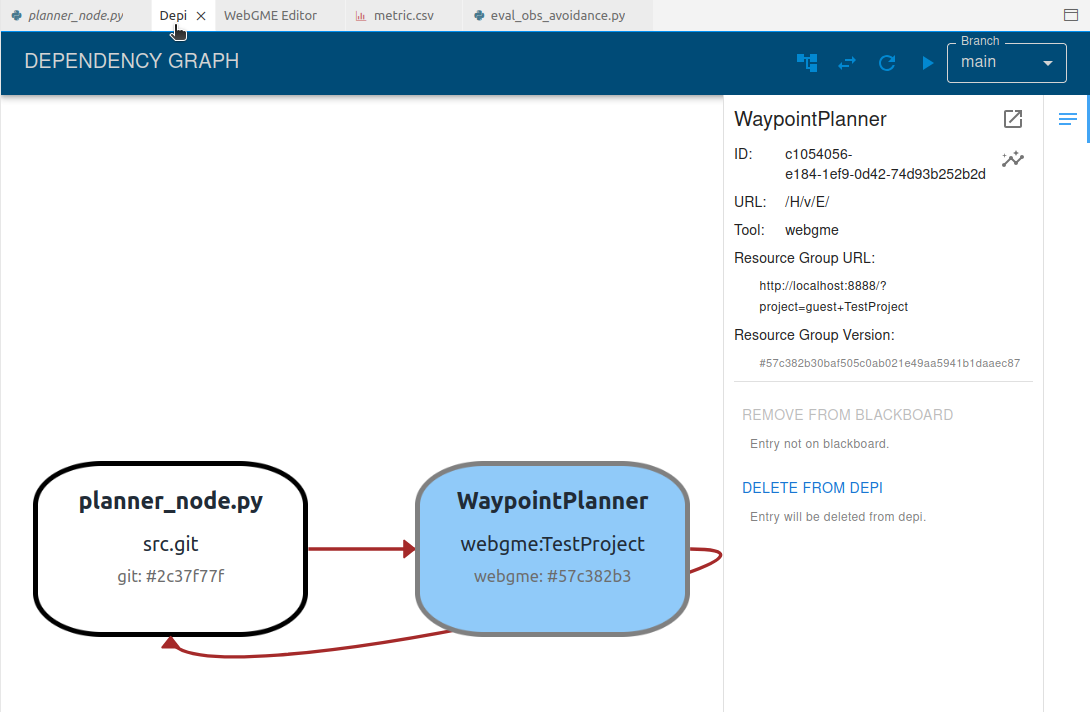
Notice that the dependency links in the dependency graph are now red to indicate that the planner_node.py file may need to be modified to bring it into synchrony with the WaypointPlanner component of the WebGME model. This situation can be managed as in the Updating a Resource when its Dependencies Change Section section.
NOTE: WebGME can be executed at any time by entering
>WebGME: Modeling Editorinto theCommand Palette: